Grades matter in predicting the number of OCIs extended, but after that point, grades are generally no better at predicting success than non-academic factors
The 2021 Toronto 2L Summer Recruit was unique, to say the least. Unlike Ultra Vires’ previous Recruitment Specials, where a full set of 1L grades were available for analysis, the majority of this year’s 2L applicants only had a single semester of 1L Fall grades because the Faculty implemented a mandatory Credit/No Credit system for all 1L Winter grades and full-year course grades. However, this year’s recruit participants had their Fall 2L grades available, which makes this analysis even more interesting. Unlike in 1L, students choose their classes in 2L.
1L Grades and Recruit Success
This analysis included participants who responded to all questions asking about grades in all seven required 1L courses. Participants were excluded if they reported a blank number (i.e., not a positive integer nor zero) in the number of OCI applications sent, non-OCI applications sent, OCIs received, OCIs accepted, in-firms received, in-firms accepted, and offers received. Of 127 total participants, 91 qualified to be included in the analysis.
Before we proceed, it is important to acknowledge the effect of self-selection bias. It is to be expected that students are more likely to participate in the survey and share their results if they performed better academically or were more satisfied with the outcome of the recruit. In the table below showing the distribution of 1L and 2L grades, this self-selection bias is supported by the overrepresentation of Hs at the expense of Ps. Of the total 91 qualified participants 60 secured at least one offer.
Scaled GPA Calculation
Because students took the seven mandatory 1L courses in different orders (with the exception of LRW in the Fall), and only 1L Fall grades were available, most students had a limited number of graded (i.e., non-CR/NCR) courses.
| Course | Constitutional | Contracts | Criminal | LRW | Legal Process | Property | Torts |
| No. of reported grades | 34 | 39 | 46 | 90 | 12 | 42 | 46 |
An unweighted numeric GPA was assigned for each reported grade.
Once a Scaled GPA was calculated for each student
The Findings
There was an overrepresentation of Hs and underrepresentation of Ps. This could be the outcome of self-selection bias or a result of the limited number of grades available per course, given the mandatory CR/NCR policy in Winter 1L grades.
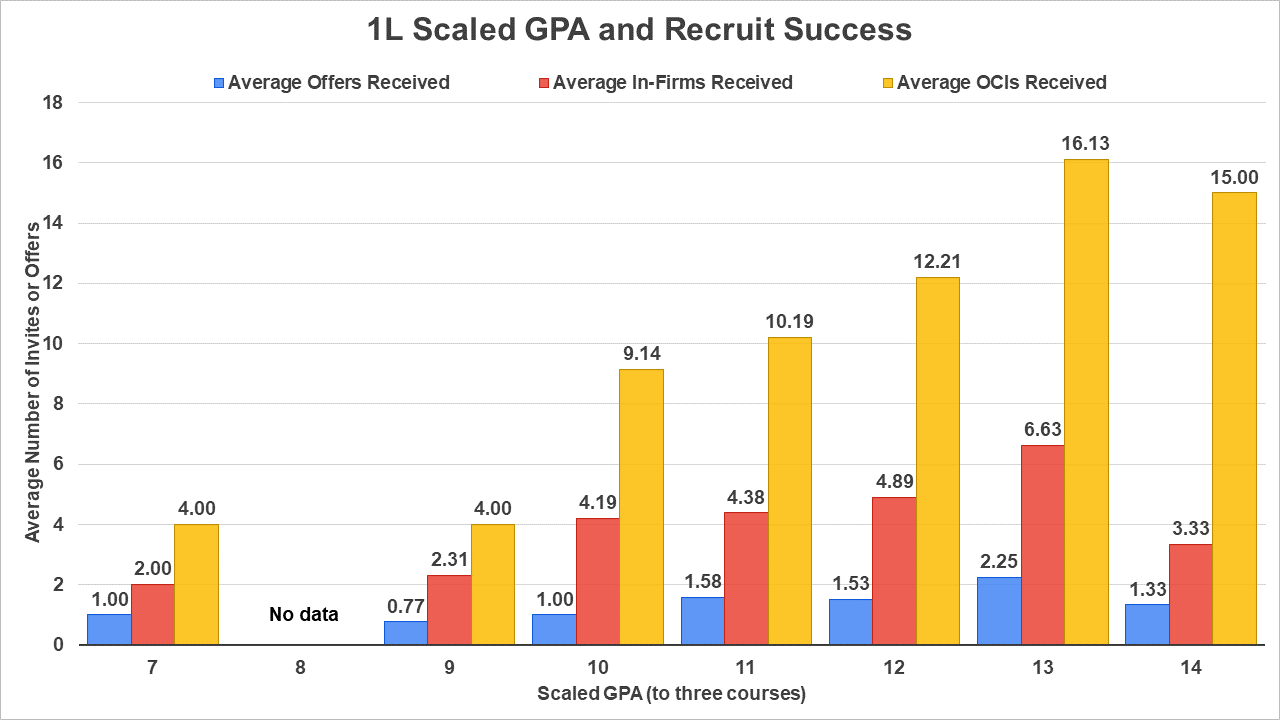
For the 1L grades, the average participant had a mean and median Scaled GPA of 10.9 and 11, respectively. A Scaled GPA of 11 is equivalent to: P, H, H, or P, P, HH. Like previous years, there is a strong upward trend in the average number of OCIs received as Scaled GPA increases. The trend is even more evident when the grades are divided into more granular units. However, take these numbers with a grain of salt — especially at the extremes of the distribution, since their smaller sample sizes may not be representative.
The positive correlation was also evident in the average number of in-firm interviews received, although much less pronounced. The mean and median number of in-firm interviews received were 4.29 and 3, respectively.
Finally, with respect to the number of offers received, among all Scaled GPA groups, the number fluctuated around one. The mean and median were 1.36 and 1, respectively.
| 1L Grade | Count (%) | Expected | Difference |
| HH | 40 (14%) | 41 (15%) | -1 |
| H | 100 (36%) | 83 (30%) | +17 |
| P | 134 (49%) | 152 (55%) | -18 |
| LP | 2 (1%) | 0 (0%) | +2 |
| CR/NCR | 328 |
2L Grades and Recruit Success
The same exclusion criteria used for analyzing 1L Fall grades were used for the 2L Fall grades. From the same pool of students who proceeded in the 1L grades analysis, 12 students were excluded from this analysis, for not reporting their 2L Fall grades.
Additionally, the same technique of Scaled GPA proved useful in analyzing Fall 2L grades. Because students took a different number of courses, we could not simply add the unweighted GPA grades of all courses for each student, as this would simply inflate the GPAs of students with more courses.
All students’ GPAs were scaled to four courses because most students were enrolled in four graded courses.
The Findings
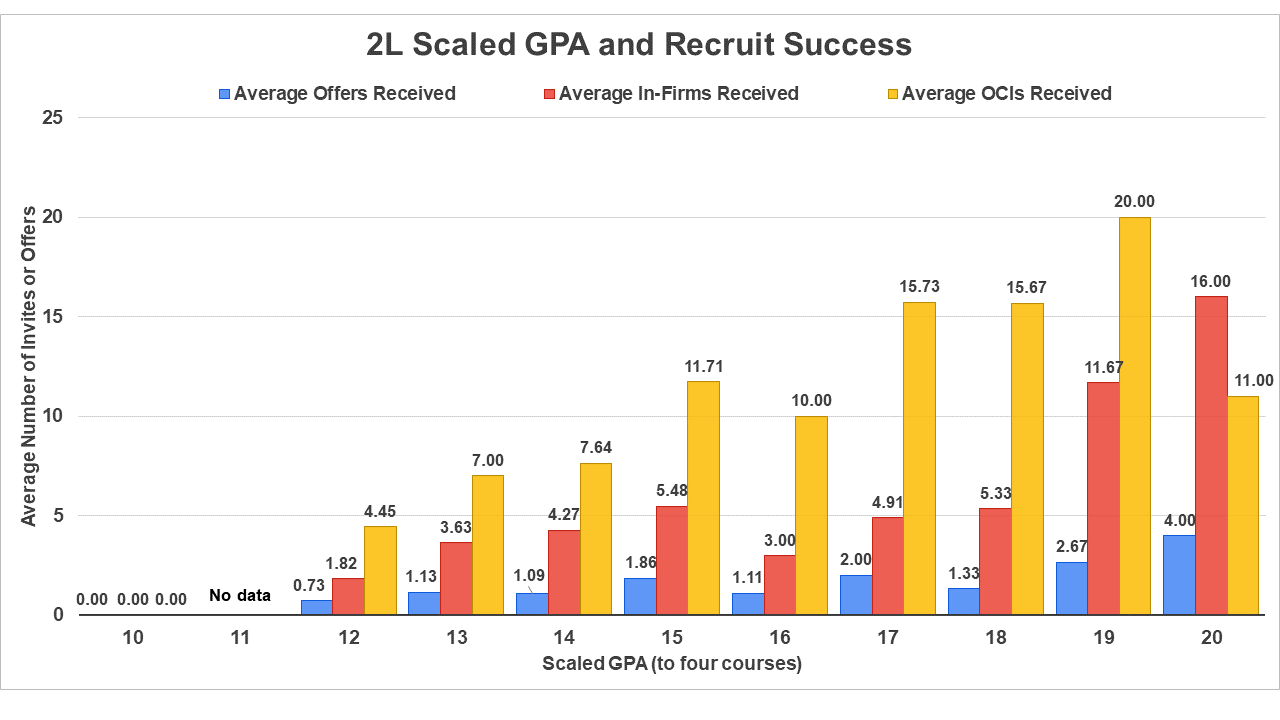
Because 2L GPAs were scaled to 4 courses, unlike 3 courses in 1L grades, there are more possible configurations of grades, which make up the 11 groups of distinct Scaled GPA that range from 10-20 (unlike the 8 distinct groups in 1L, ranging from 7-14). Please use additional caution when interpreting the data given the smaller sample sizes in each group, especially in the extremes.
There was an overrepresentation of Hs and HHs at the expense of Ps (see table below outlining the distribution of 2L grades), which was more heightened than in 1L grades. This outcome could be the result of the following two reasons: (i) self-selection bias favoring those who performed better academically; or (ii) students tended to do better in 2L courses because they had discretion to select the courses they were most interested in taking.
For the 2L grades, the average participant had a mean and median Scaled GPA of 14.9 and 14.67, respectively. A Scaled GPA of 15 is equivalent to: P, H, H, H or P, P, H, HH. As with the 1L grades, we see a positive correlation between average OCIs received and Scaled GPA. This correlation, however, was moderate in strength.
| 2L Grade | Count | Expected | Difference |
| HH | 45 (17%) | 41 (15%) | +4 |
| H | 111 (41%) | 82 (30%) | +29 |
| P | 115 (42%) | 150 (55%) | -35 |
| LP | 1 (0%) | 0 (0%) | +1 |
| CR/NCR | 12 (Excluded) |
Combined 1L & 2L Grades and Recruit Success
This is where it all comes together. Presumably, employers will have taken into account both 1L Fall and 2L Fall grades. For each of the 79 students that qualified for both 1L and 2L grades analyses,
Because the 1L & 2L Scaled GPA is representative of seven graded courses, there are even more possible configurations of grades than earlier analyses. Specifically, there are 14 different groups of grades, ranging from 20-33. Please use additional caution in interpreting the data given the smaller sample sizes in each group, especially in the extremes.
The Findings
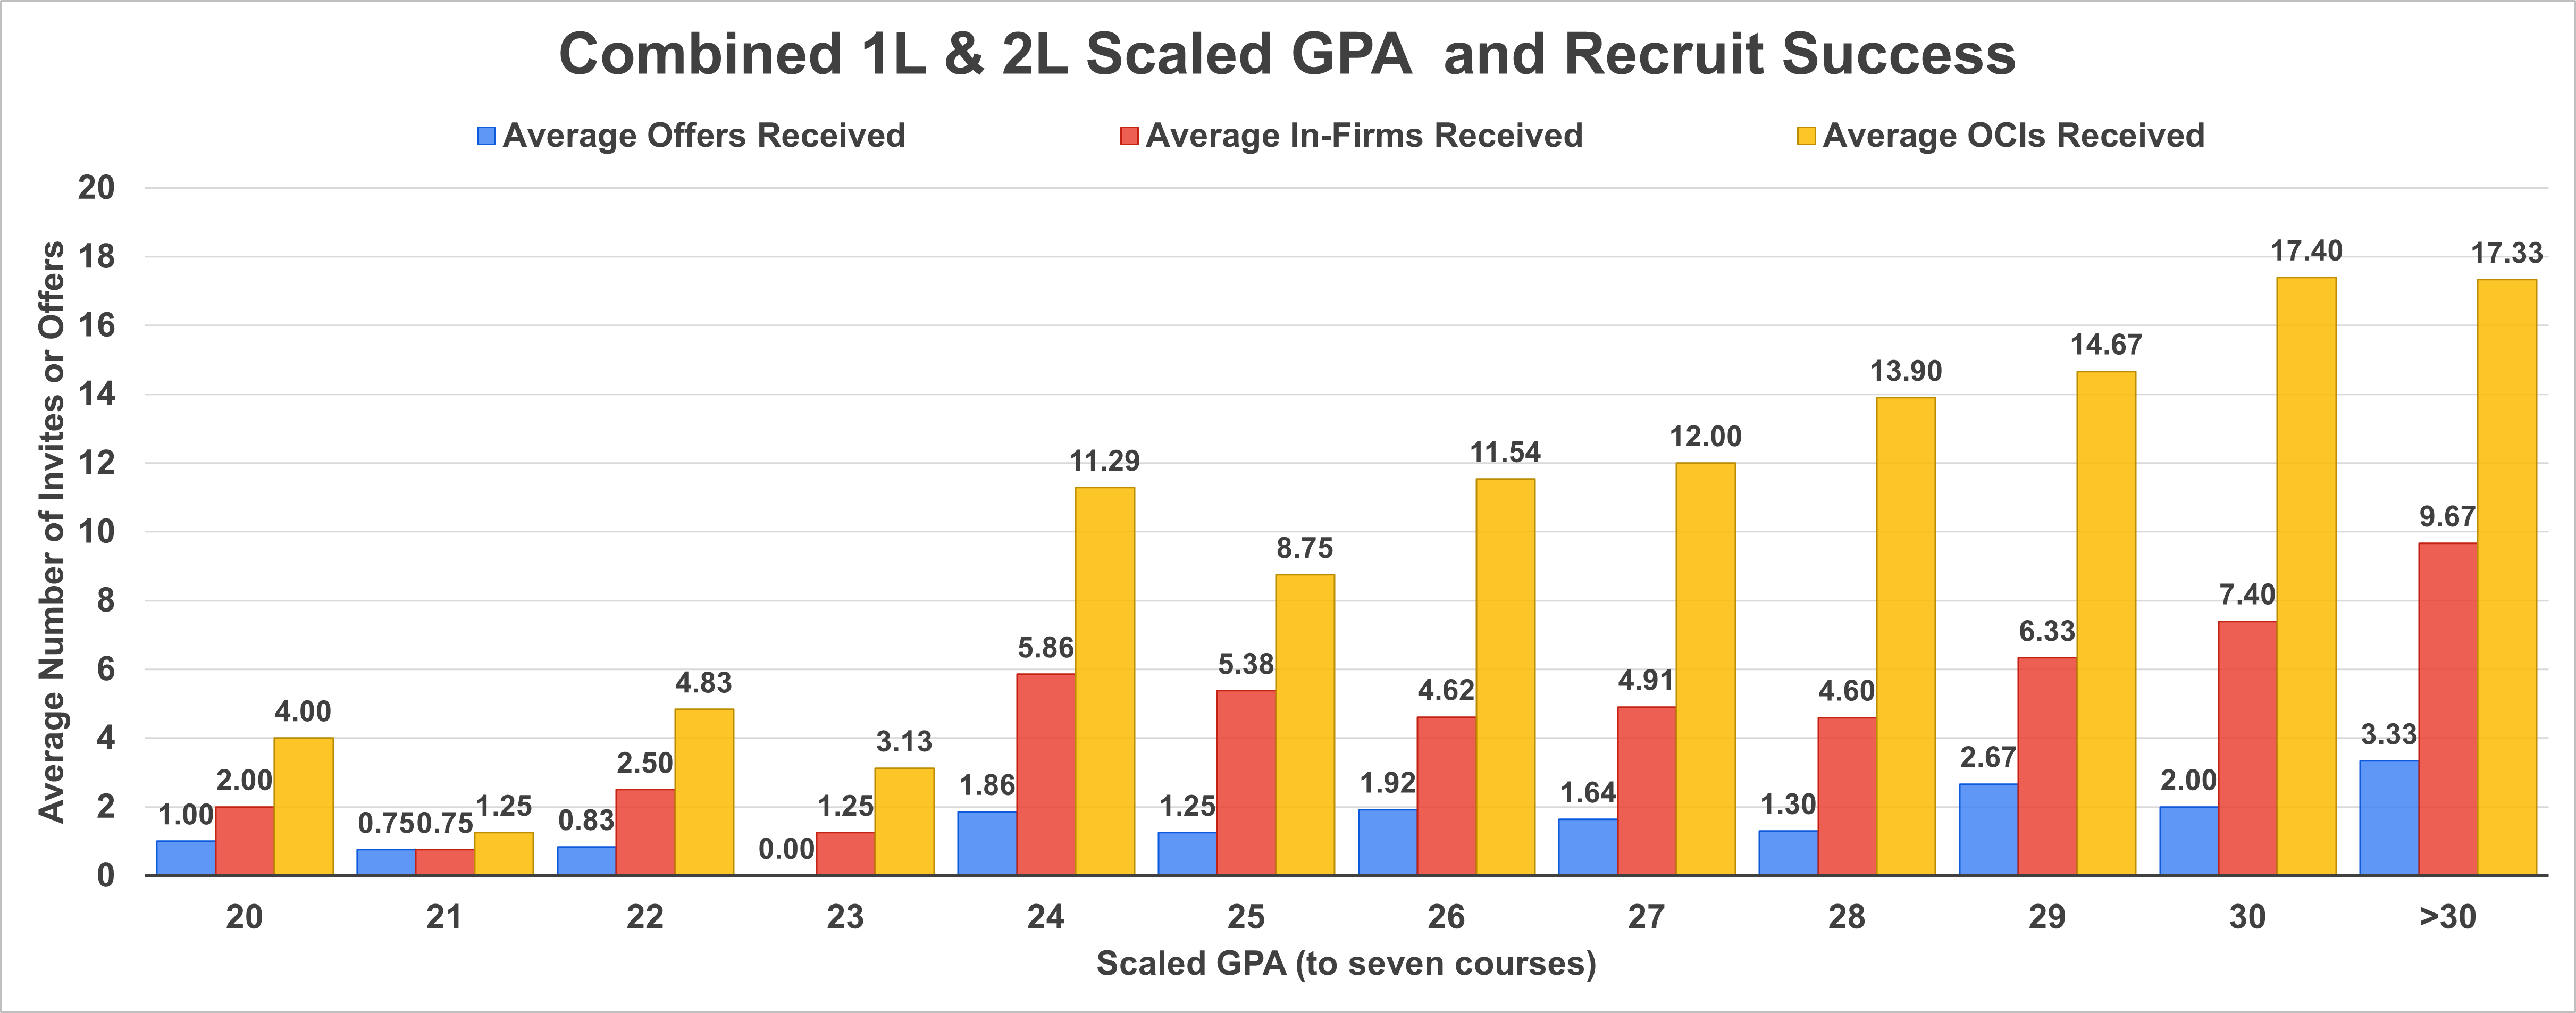
For the combined 1L & 2L Scaled GPA, the average participant had a mean and median Scaled GPA of 25.78 and 26, respectively. A Scaled GPA of 26 is equivalent to: 2 Ps, 5 Hs or 3 Ps, 3 Hs, 1 HH or 4 Ps, 1 H, 2 HHs, etc. As with the 2L grades, we see the same moderate positive correlation between OCIs received and Scaled GPA. The persistence of this trend, despite the presence of 14 different grade categories/intervals, supports the idea that grades are correlated with the number OCI received. In other words, had this grades-to-OCI association been weaker, one would expect to see external factors, such as resume and cover letter factors, disturb the increase in OCIs as grades increase. We see this phenomenon more clearly in the red bars representing average in-firm interviews received. There, a “U” shaped trend is visible starting at the GPA of 24 (which is equivalent to 4 Ps and 3 Hs). A similar trend is also evident in the number of offers received (blue bars), where at GPA of 24 and upwards, the average number of offers in each category fluctuates around 2.
Although the average number of offers fluctuated around 2 in most grade categories, when comparing the 1L & 2L Scaled GPA of those who ended up with at least one offer to those without any offers, there was a statistically significant difference: mean Scaled GPA for those with at least one offer was 26.33 while those with no offers was 24.60.
With the exception of grades being statistically significantly different for those with offers and no offers, the three preceding trends mirror previous years and suggest a recurring theme: grades matter a great deal in predicting the number of OCIs extended, but after that point, grades are generally no better at predicting success than non-academic factors. Hopefully this offers some reassurance that grades are not everything.
| 1L & 2L Grades | Count | Expected | Difference |
| HH | 85 (15.5%) | 82 (15%) | +3 |
| H | 211 (39%) | 164 (30%) | +47 |
| P | 249 (45%) | 301 (55%) | -52 |
| LP | 3 (0%) | 0 (0%) | +3 |
| CR/NCR | 12 (Excluded) |
| Class Rank (1L & 2L Scaled GPA | Expected Applications per Offer | Percentage of Applications Resulting in an Offer |
| Top Quarter (28+) | 7.53 | 13% |
| Upper Half (26-27) | 11.05 | 9% |
| Lower Half (24-25) | 11.13 | 9% |
| Bottom Quarter (20-23) | 51.12 | 2% |
Appendix
| 1L Scaled GPA | Count Distribution (%) | Average OCIs Received | Average In-Firms Received | Average Offers Received |
| 7 | 1 (1%) | 4.00 | 2.00 | 1.00 |
| 8 | No data | No data | No data | No data |
| 9 | 13 (14%) | 4.00 | 2.31 | 0.77 |
| 10 | 21 (23%) | 9.14 | 4.19 | 1.00 |
| 11 | 26 (29%) | 10.19 | 4.38 | 1.58 |
| 12 | 19 (21%) | 12.21 | 4.89 | 1.53 |
| 13 | 8 (9%) | 16.13 | 6.63 | 2.25 |
| 14 | 3 (3%) | 15.00 | 3.33 | 1.33 |
| 2L Scaled GPA | Count Distribution (%) | Average OCIs Received | Average In-Firms Received | Average Offers Received |
| 10 | 1 (1%) | 0.00 | 0.00 | 0.00 |
| 11 | No data | No data | No data | No data |
| 12 | 11 (14%) | 4.45 | 1.82 | 0.73 |
| 13 | 8 (10%) | 7.00 | 3.63 | 1.13 |
| 14 | 11 (14%) | 7.64 | 4.27 | 1.09 |
| 15 | 21 (27%) | 11.71 | 5.48 | 1.86 |
| 16 | 9 (11%) | 10.00 | 3.00 | 1.11 |
| 17 | 11 (14%) | 15.73 | 4.91 | 2.00 |
| 18 | 3 (4%) | 15.67 | 5.33 | 1.33 |
| 19 | 3 (4%) | 20.00 | 11.67 | 2.67 |
| 20 | 1 (1%) | 11.00 | 16.00 | 4.00 |
| 1L & 2L Scaled GPA | Count Distribution (%) | Average OCIs Received | Average In-Firms Received | Average Offers Received |
| 20 | 1 (1%) | 4.00 | 2.00 | 1.00 |
| 21 | 4 (5%) | 1.25 | 0.75 | 0.75 |
| 22 | 6 (8%) | 4.83 | 2.50 | 0.83 |
| 23 | 8 (10%) | 3.13 | 1.25 | 0.00 |
| 24 | 7 (9%) | 11.29 | 5.86 | 1.86 |
| 25 | 8 (10%) | 8.75 | 5.38 | 1.25 |
| 26 | 13 (16%) | 11.54 | 4.62 | 1.92 |
| 27 | 11 (14%) | 12.00 | 4.91 | 1.64 |
| 28 | 10 (13%) | 13.90 | 4.60 | 1.30 |
| 29 | 3 (4%) | 14.67 | 6.33 | 2.67 |
| 30 | 5 (6%) | 17.40 | 7.40 | 2.00 |
| >30 | 3 (4%) | 17.33 | 9.67 | 3.33 |
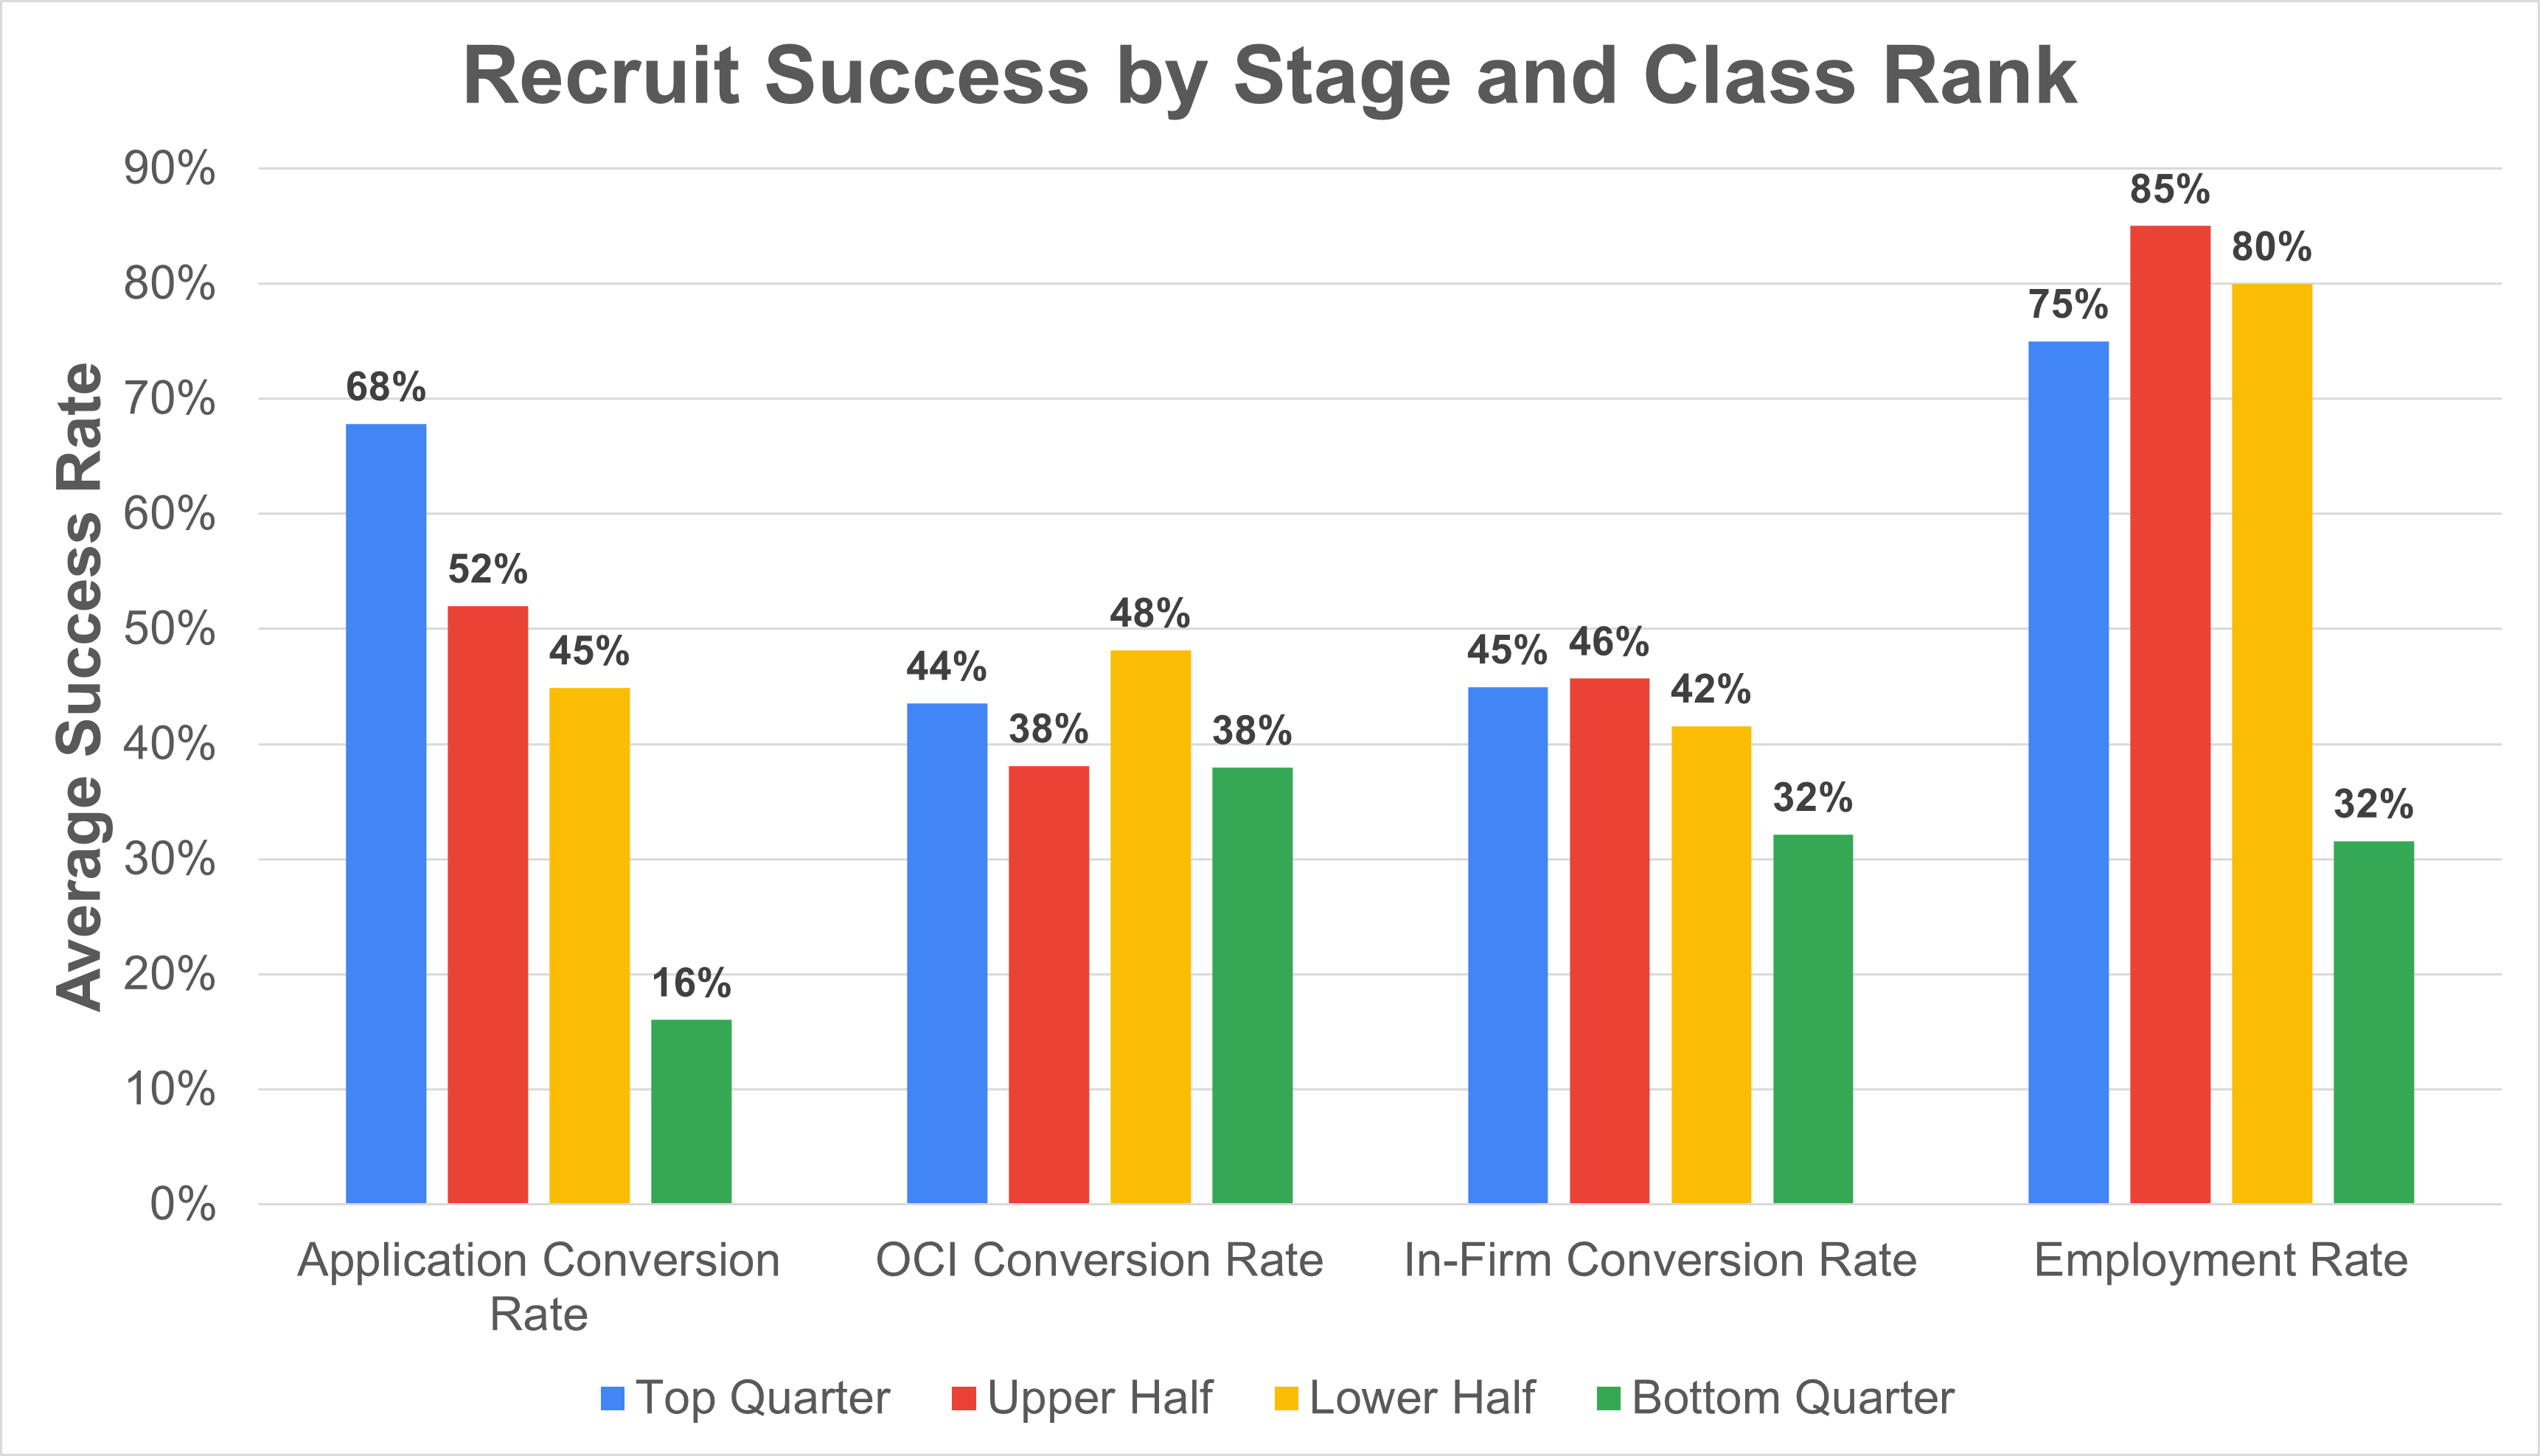
| Class Rank (1L & 2L Scaled GPA) | Count | Application Conversion Rate | OCI Conversion Rate | In-Firm Conversion Rate | Employment Rate | Total Applications |
| Top Quarter (28+) | 20 | 68% | 44% | 45% | 75% | 506 |
| Upper Half (26-27) | 20 | 52% | 38% | 46% | 85% | 498 |
| Lower Half (24-25) | 20 | 45% | 48% | 42% | 80% | 522 |
| Bottom Quarter (20-23) | 19 | 16% | 38% | 32% | 32% | 468 |
| 1L Scaled GPA (to 3 courses) | 2L Scaled GPA (to 4 courses) | 1L & 2L Scaled GPA (to 7 courses) | OCIs Received | In-Firms Received | Offers Received | |
| 25th Percentile | 10 | 13.33 | 24 | 4 | 1 | 0 |
| Mean | 10.9 | 14.9 | 25.78 | 10.10 | 4.29 | 1.36 |
| 50th Percentile | 11 | 14.67 | 26 | 10 | 3 | 1 |
| 75th Percentile | 12 | 16 | 27.7 | 15 | 6 | 2 |