A comprehensive view of the 2L class reveals concerning mental health trends among law students
This year, 95 students eligible to participate in the 2L recruit completed the Ultra Vires summer recruit demographic survey: 82 were JD students, five were JD/MBA students, and eight were JD/other combined degree students. Due to a larger sample size compared to previous years, we gained a more in-depth view of the Class of 2023. Thank you to everyone who participated in our data collection.
Age, Gender, and Identities
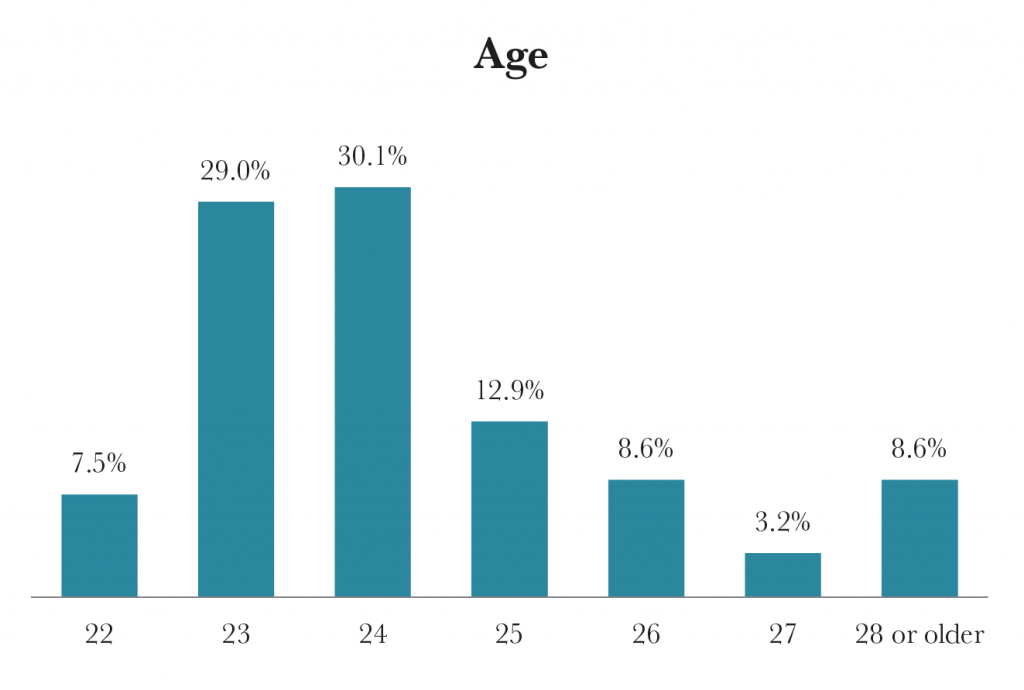
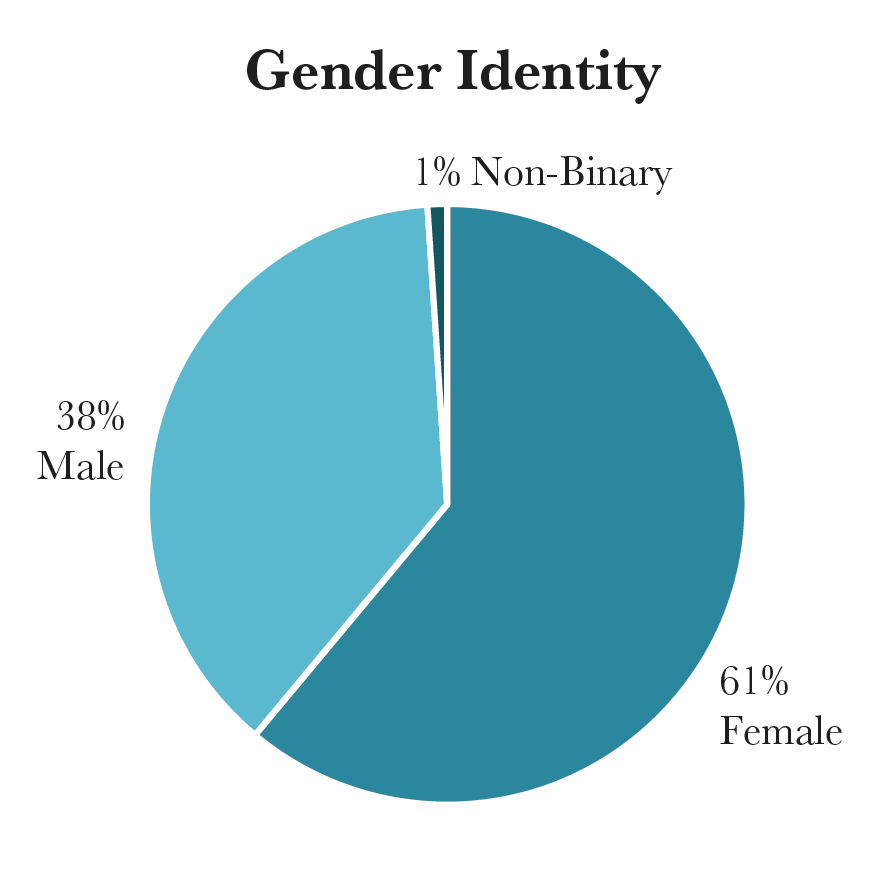
All 95 survey respondents answered the age and gender questions. The average age of the survey respondents was 24.3, with the youngest being 22 years old and the oldest being over 28 years old. 58 students identified as female, one student identified as non-binary, and 36 students identified as male.
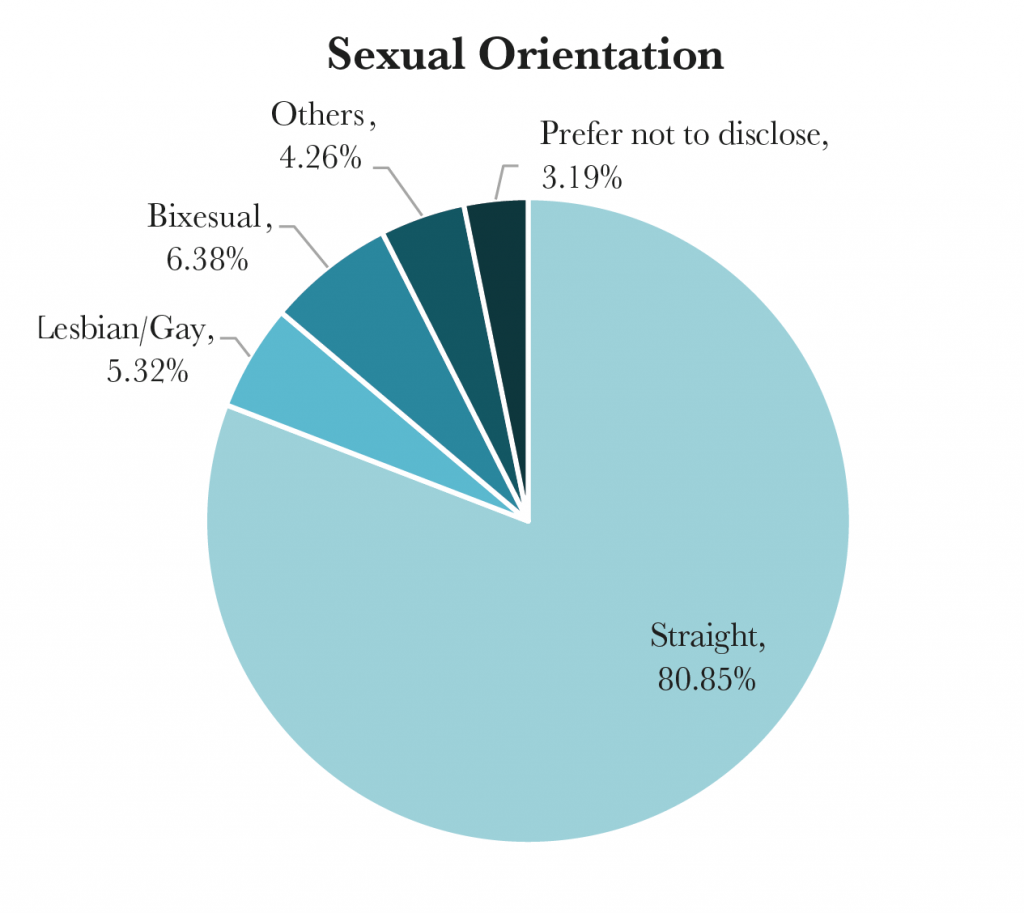
94 students responded to the sexual orientation question. About 80 percent of the students identified as straight, and about 17 percent of students identified as LGBTQ2S+.
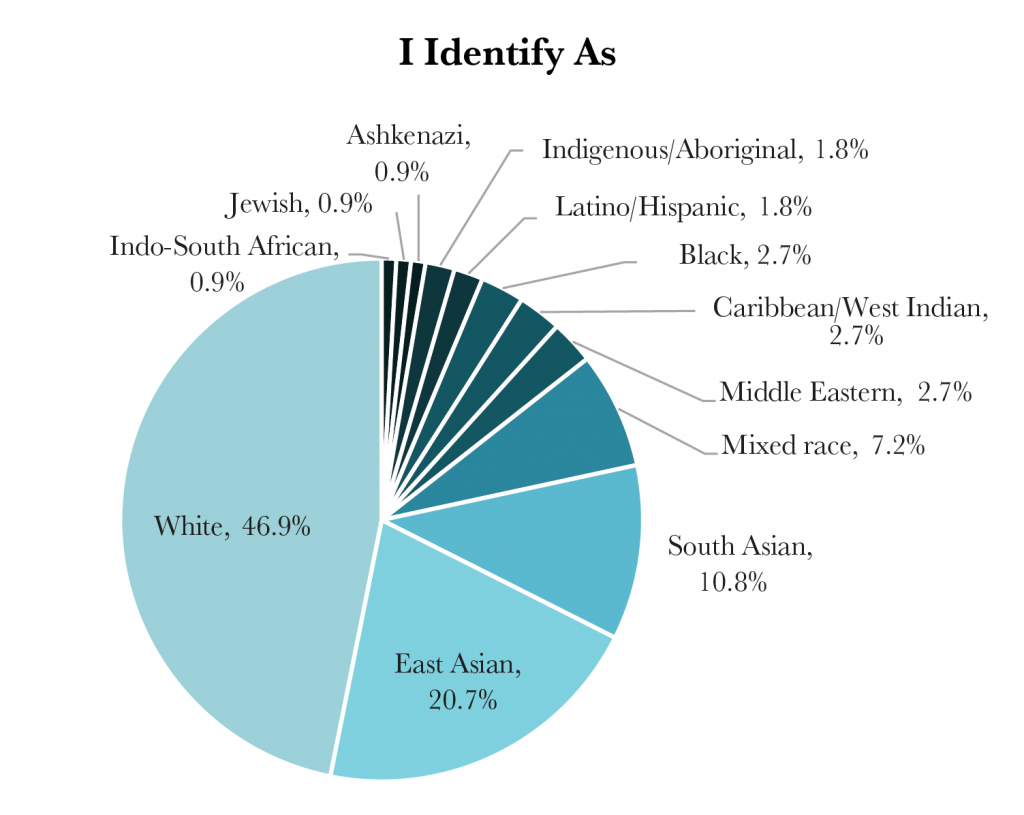
Over 90 students provided information about their racial identities; around 45 percent of students identified as a visible minority.
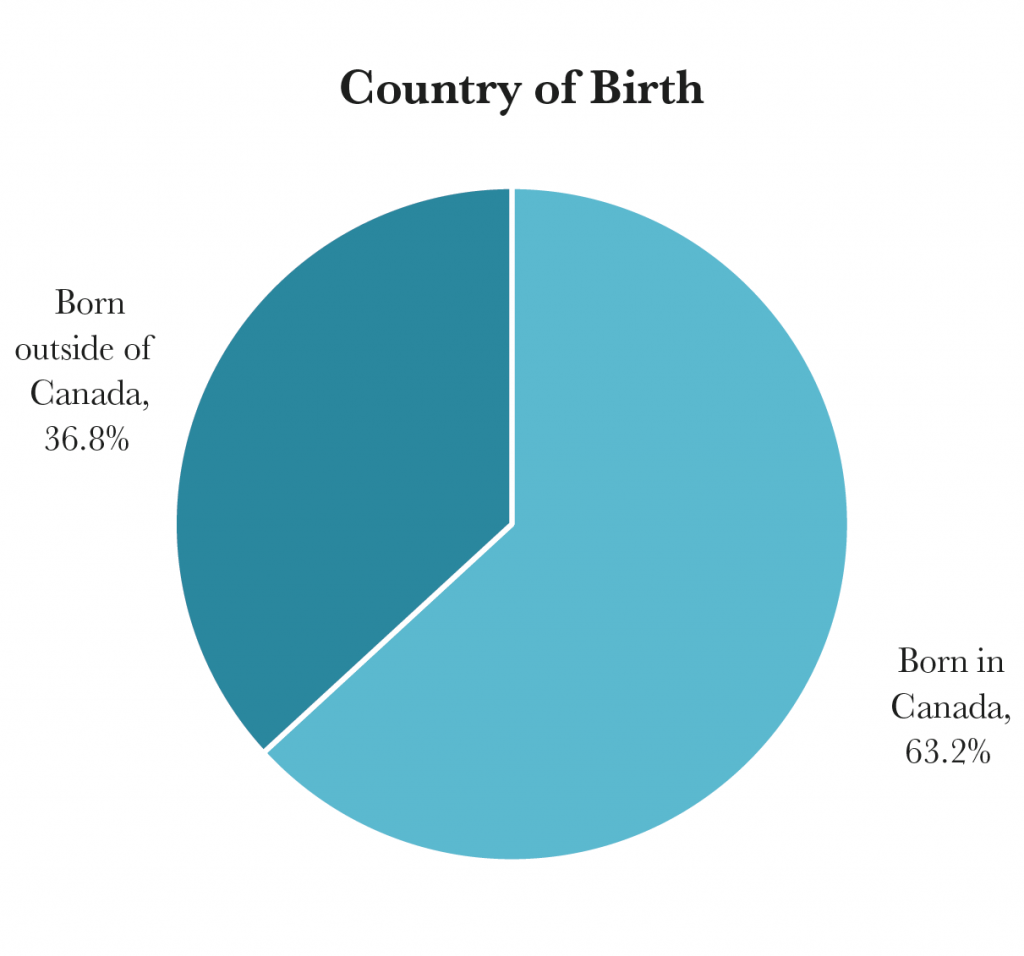
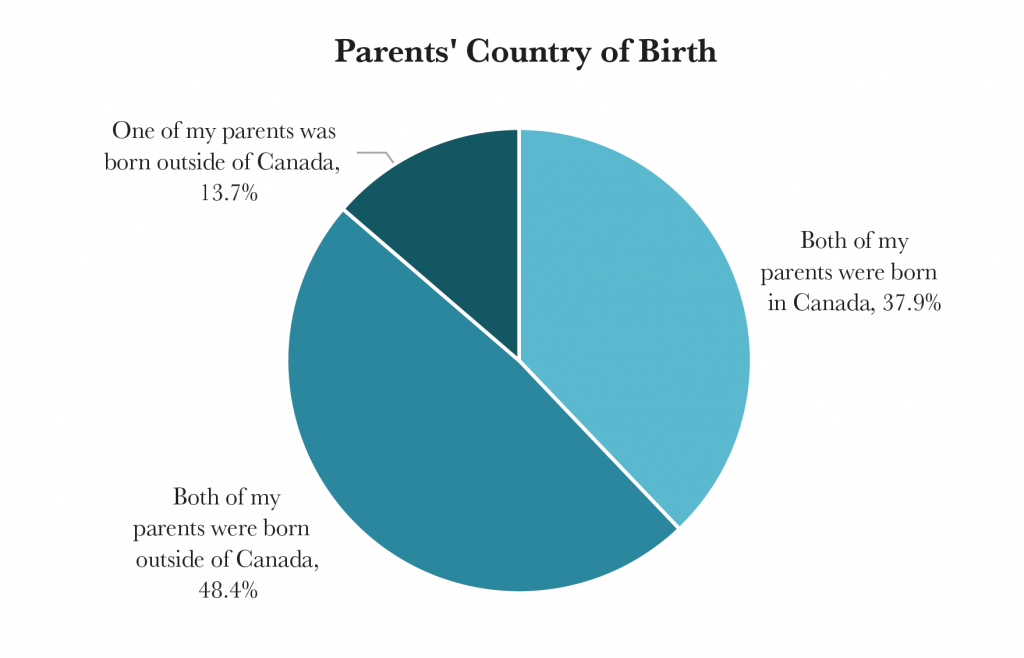
95 students responded to the country of birth questions. 60 students were born in Canada, while 35 students were born outside of Canada. 36 students’ parents were born in Canada, and 59 students have one or both parents born outside of Canada.
Religion, Languages, and Personalities
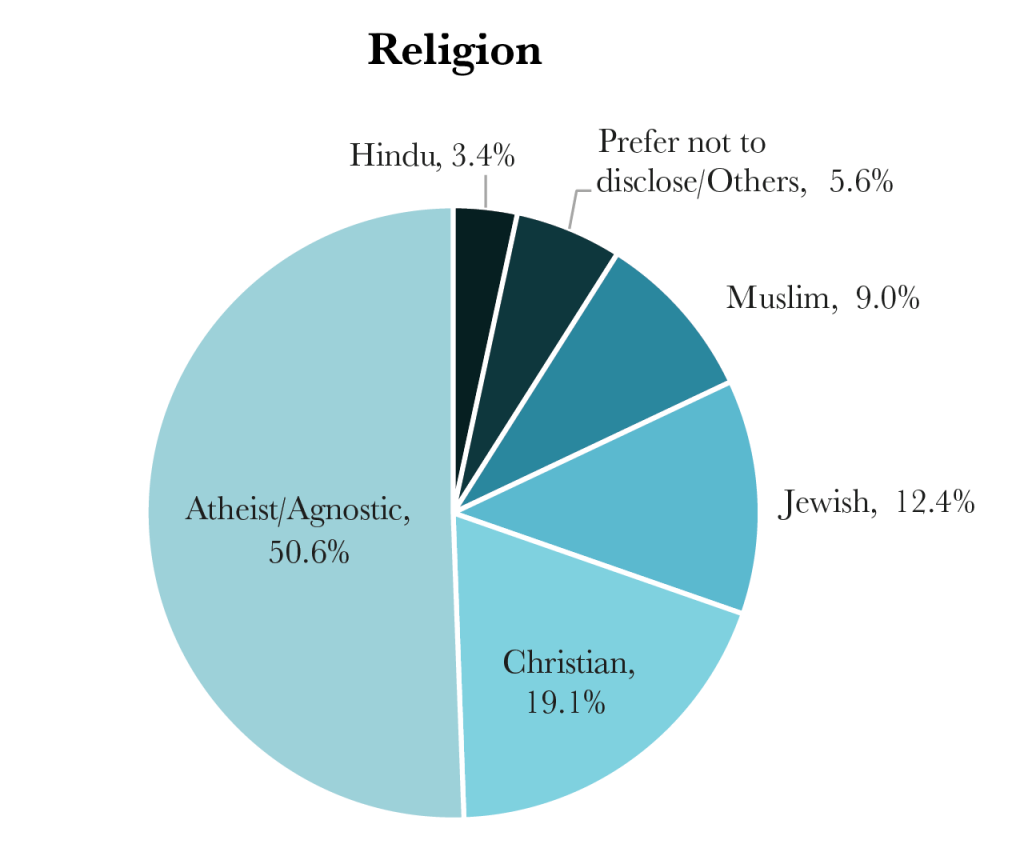
As in previous years, we asked whether students hold religious beliefs and how important their religions are to them. The results are shown below. Around 50 percent of students were atheists, 19 percent of students were Christian, and 12 percent of students were Jewish. 91 students rated the importance of religion to them on a one to five scale; the mean value was 2.21.
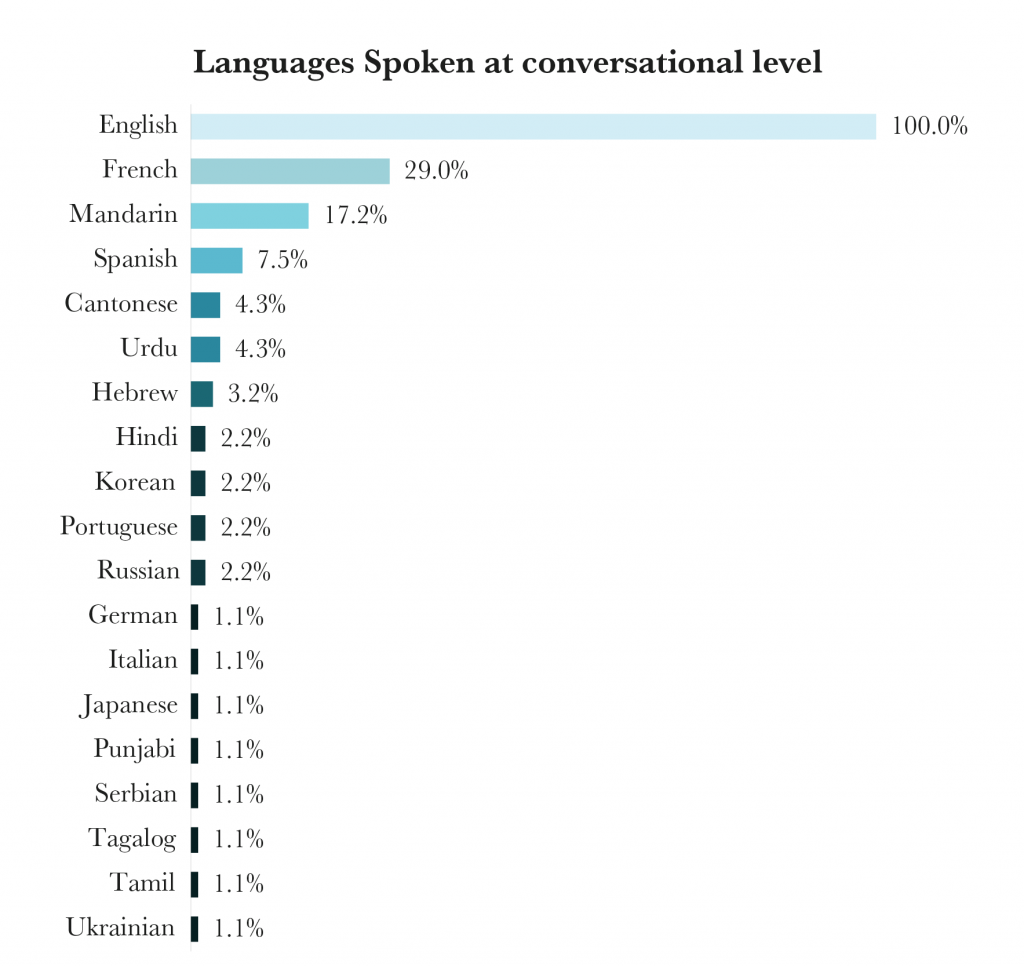
We also asked questions about language proficiencies. Of the 92 students who reported the number of languages they speak, 54 students spoke at least two languages at a conversational level. The average number of proficient languages was 1.84. Apart from English, the most common languages spoken were French (29 percent), Mandarin (17 percent), and Spanish (8 percent). 20 out of 94 students reported that they are bilingual in English and French.
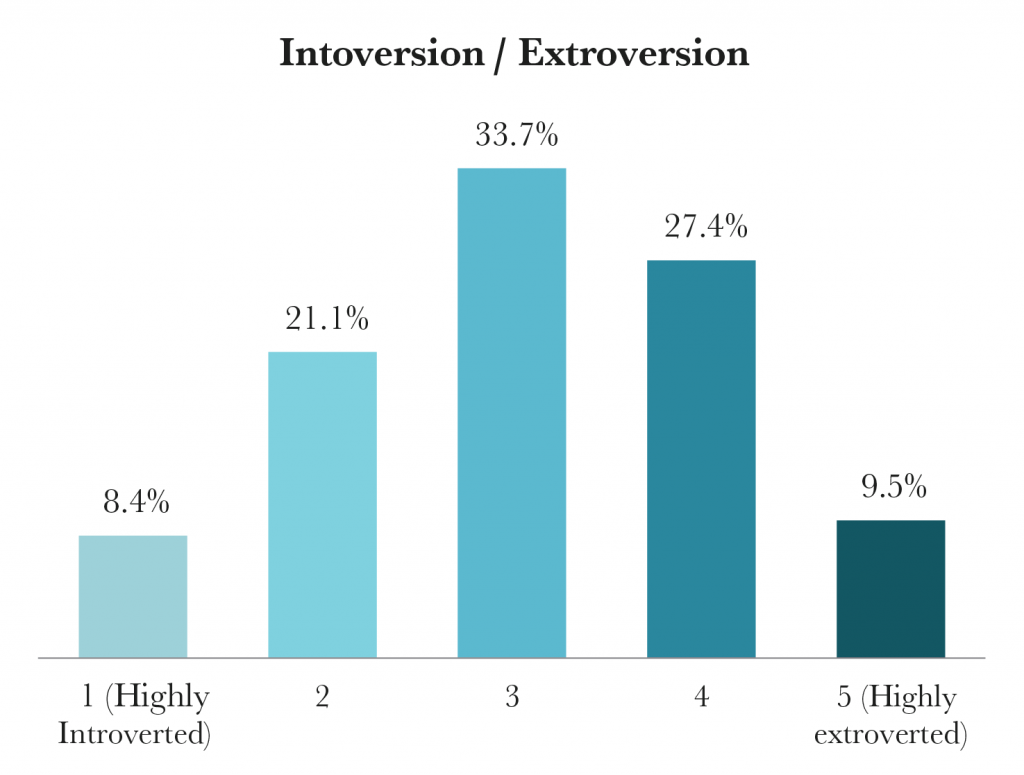
All 95 survey respondents rated themselves on an introvert/extrovert scale, with one being most introverted and five being most extroverted. The mean value was 3.08, and there were seven more students who identified as extroverts than students who identified as introverts.
Finances and Parents’ Education
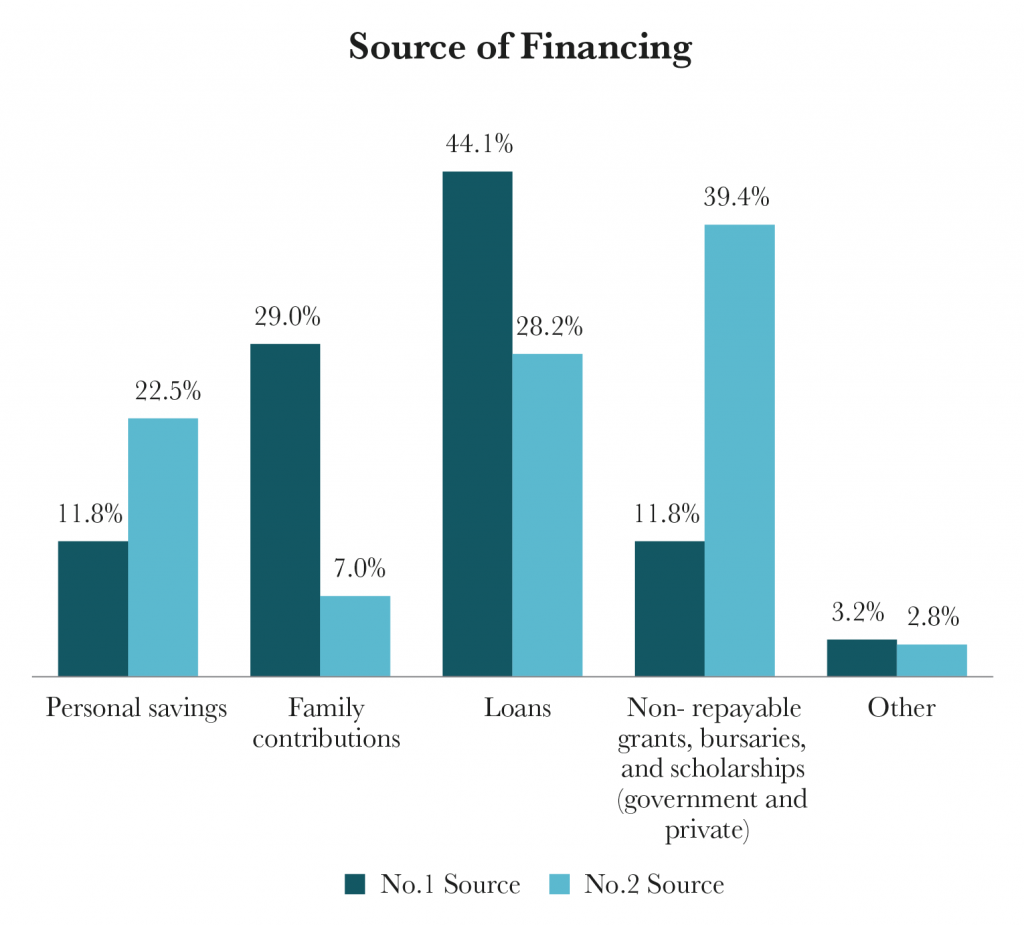
The median pre-tax household income of the survey respondents falls under the $100,001-$150,000 range. 79 percent of the students attended public high schools, while 19 percent of students attended private high schools. The most-used financing source of the survey respondents was loans, followed by family contributions and grants, scholarships, and bursaries.
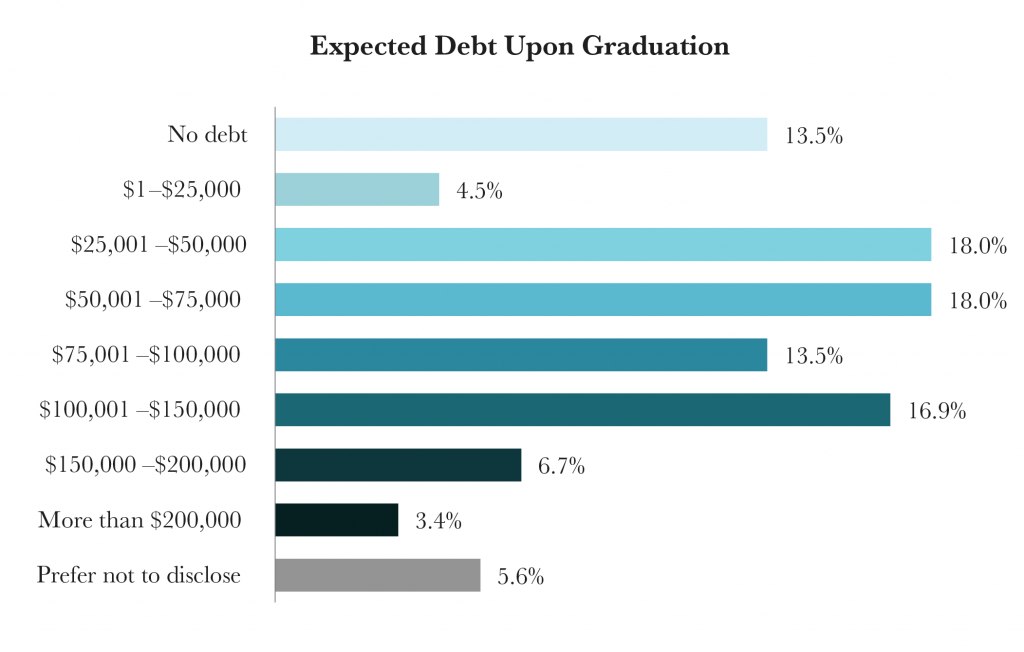
The majority of survey respondents anticipated some levels of debt upon graduation. The most commonly reported debt levels were $25,001-$50,000 and $50,001-$75,000 (18 percent, respectively), followed by $100,001-$150,000 (17 percent).
78 percent of survey respondents are the first in their families to attend law school. The majority of students have one or more immediate family members with university education; only eight out of 94 students reported that they were the first in their families to attend university.
The most commonly reported highest level of parents’ education was a Bachelor’s degree (excluding law degrees) (41 percent), followed by a Master’s degree (20 percent). 10 percent of the survey respondents’ parents had a law degree.
Academic Record, Work Experience, and Study Habits
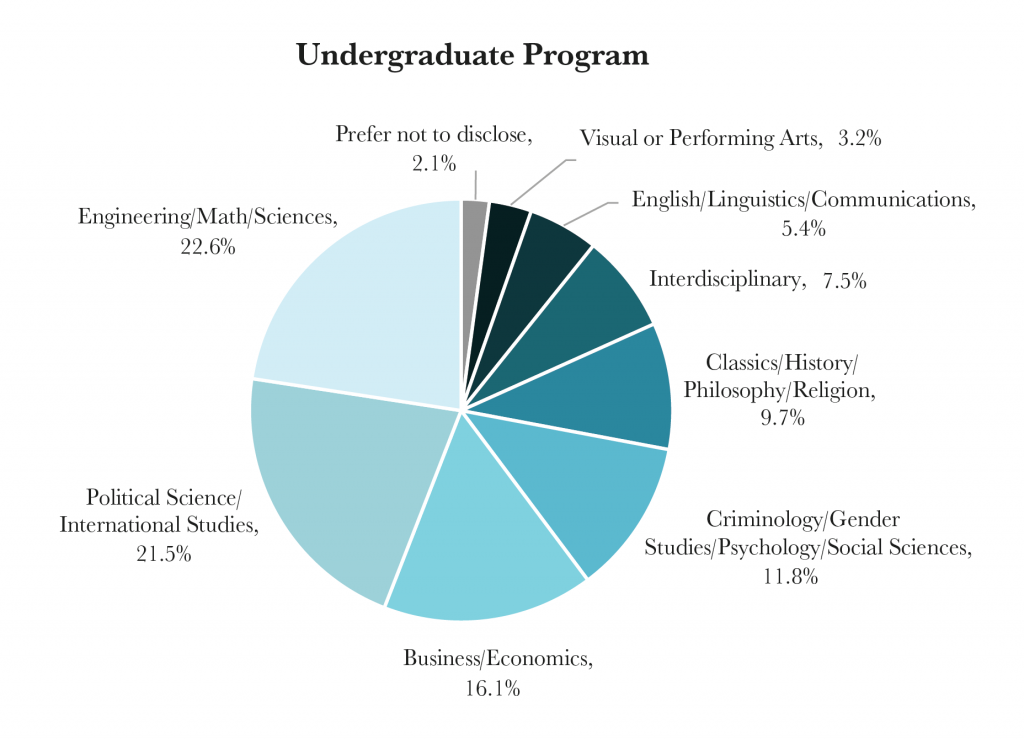
87 students reported their undergraduate GPA (OLSAS scale out of 4.0) and LSAT scores. The median reported GPA was 3.87, while the 25th percentile was 3.75 and the 75th percentile was 3.93. The lowest reported GPA was 3.3 and the highest reported GPA was 4.0. The median reported LSAT score was 166, while the 25th percentile was 164 and the 75th percentile was 169. The lowest reported LSAT score was 153 and the highest was 175. The most commonly reported undergraduate programs were Engineering/Math/Sciences (23 percent) and Political Science/International Relations (22 percent), followed by Business/Economics (16 percent) and Criminology/Gender Studies/Psychology/Socio Sciences (12 percent).
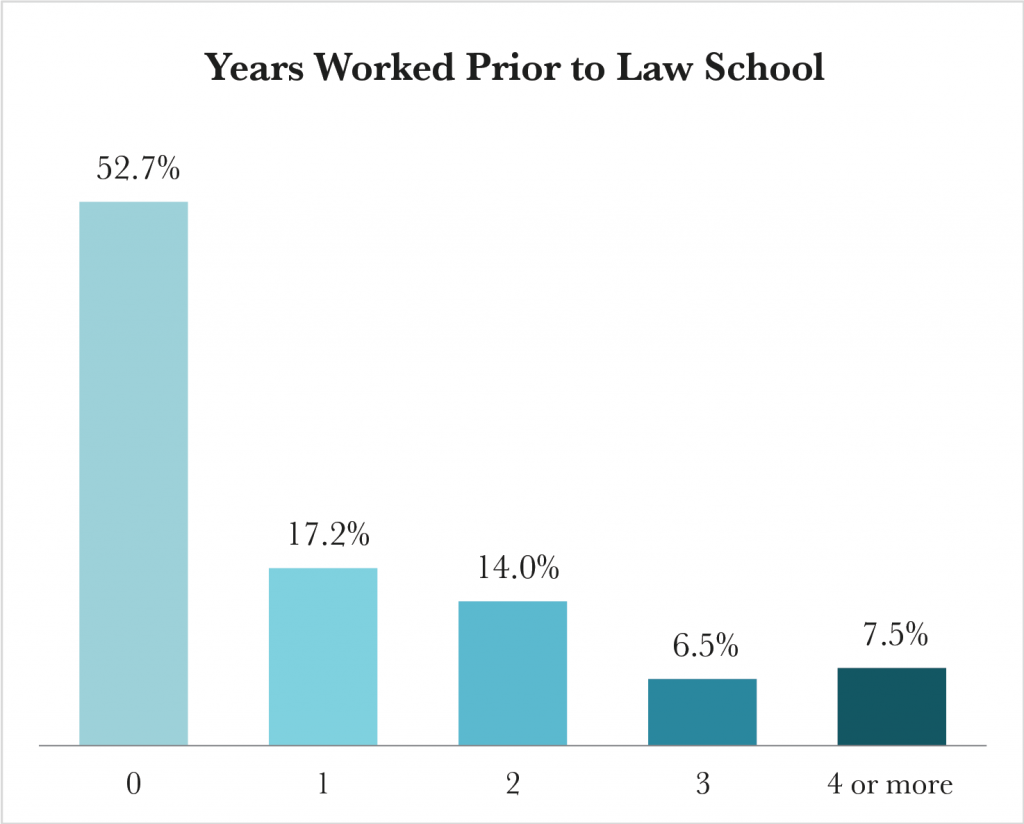
The average number of years worked before attending law school was 0.97. About half of the students surveyed reported that they had no work experience prior to law school. 17 percent of students reported having one year of work experience, and 14 percent of students reported having two years of work experience. The maximum number of work years reported was four.
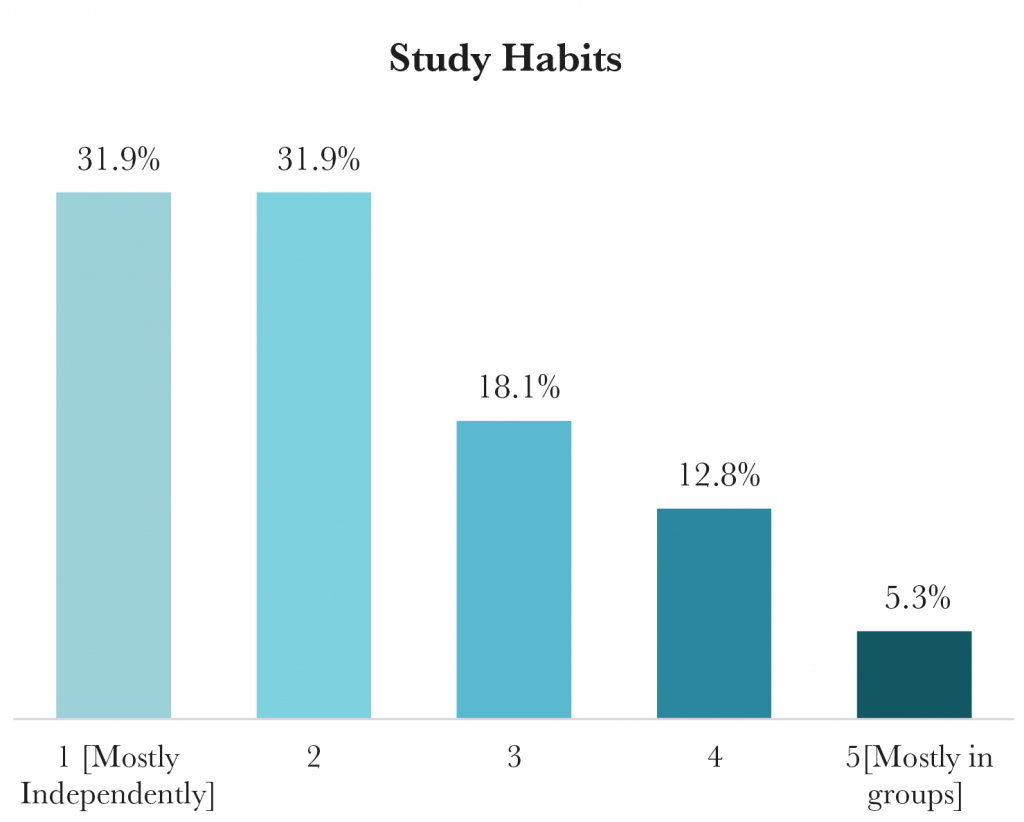
We asked students to rank their 1L study habits on a scale, with one being mostly independent and five being mostly in groups. The average number reported was 2.27. Overall, more students studied independently (64 percent) than in groups (18 percent).
Accessibility and Mental Health Challenges
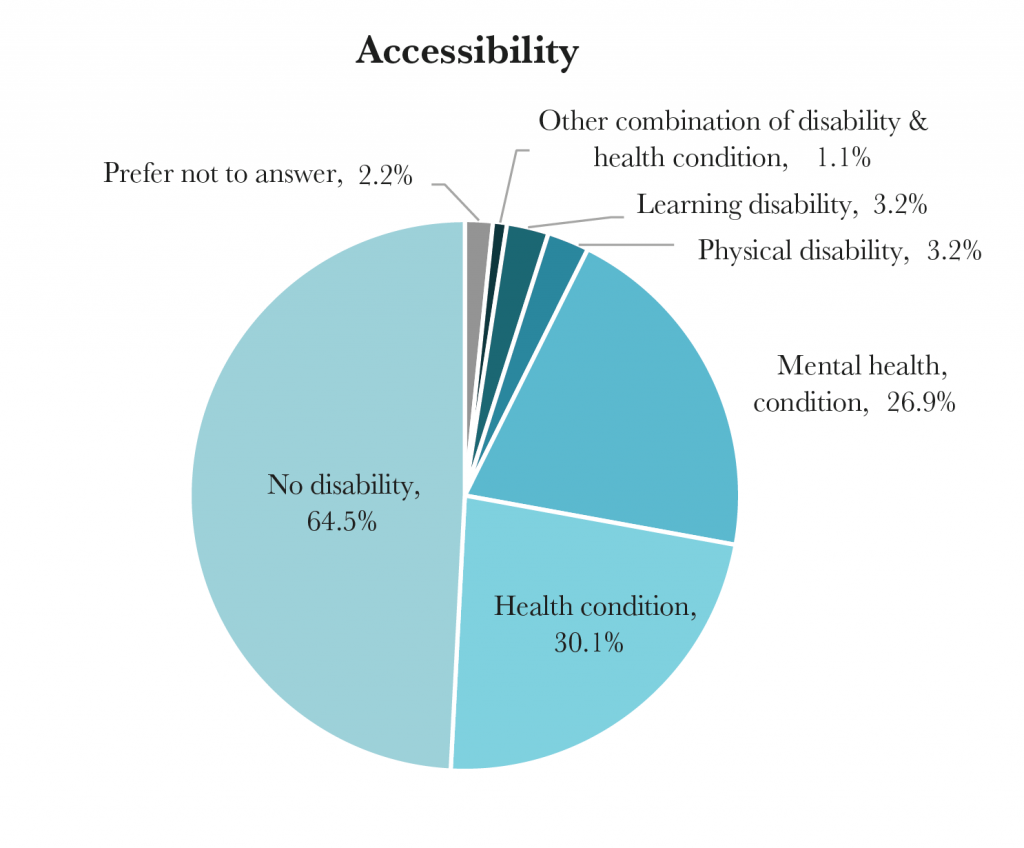
93 students responded to our accessibility and accommodations question. While 65 percent of students reported that they have no disability, 30 percent of students reported that they have a health condition, and 27 percent of students reported that they have a mental health condition. 30 students reported that they have accessed mental health resources through the law school or the university.
The results from the mental health section of our demographic survey revealed concerning trends. Among the 33 students who reported that they have a mental health condition, 59 percent of students reported that the frequency of their experience with their condition increased during law school, and 62 percent of students reported that the severity of their experience with their condition increased during law school. We asked the survey participants to rank their experience on a one to five scale, where one represents “decreased significantly” and five represents increased significantly. The average rating was 3.85 for both questions. Notably, no students reported a decrease in the frequency or severity of their experience with their mental health conditions during law school.
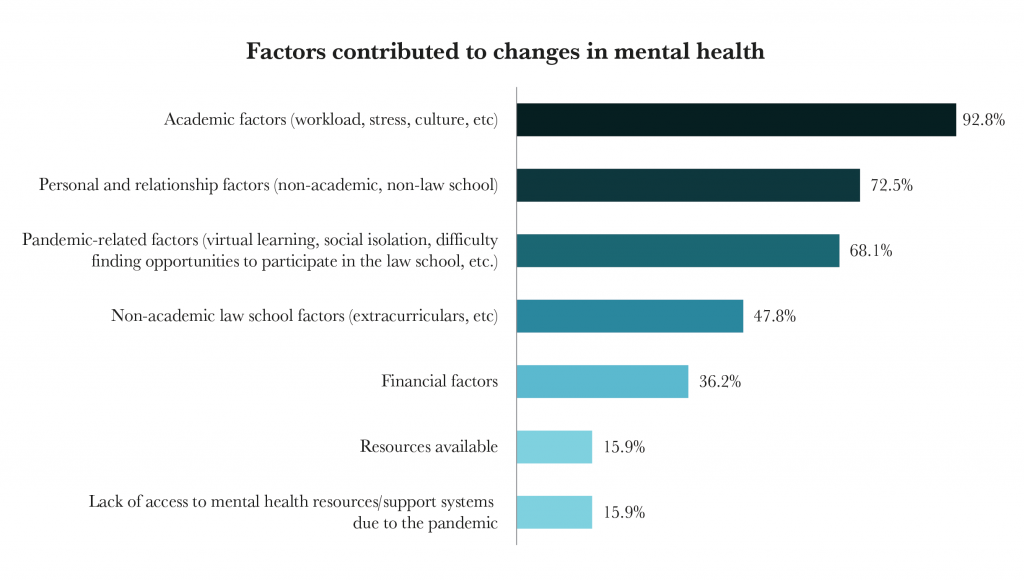
We asked students to identify the factors that contribute to changes in their mental health. Unsurprisingly, academic factors were on top of the list, which affected 93 percent of students who responded to this question. The second most significant category of factors was personal and relationship matters outside of the law school (72 percent). In addition, pandemic-related factors (68 percent) had a major influence on students’ mental health.
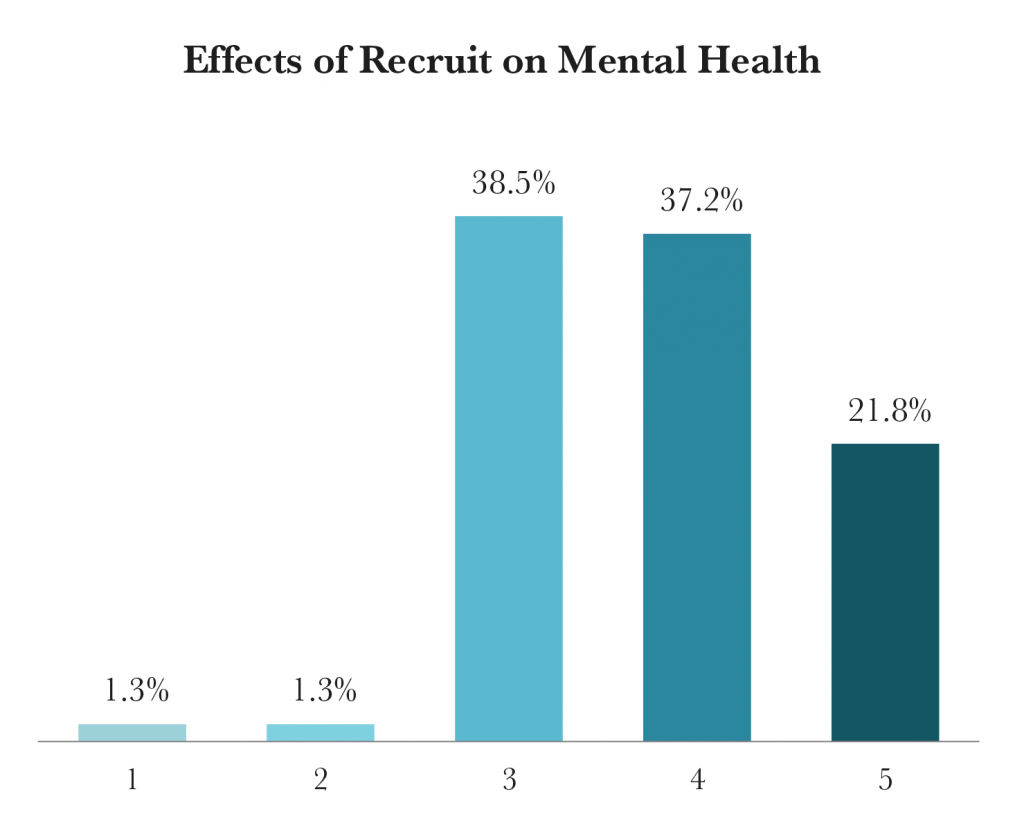
78 students rated the effects that the recruit had on their mental health on a one to five scale, with one being improved significantly and five being disturbed significantly. The average number was 3.77. Particularly, 46 students reported that the recruit has disturbed their mental health, with one student commenting, “I was extremely anxious, to the point of not being able to eat and sleep properly as well as feeling very ill.”
This is in stark contrast to the two students who reported that the recruit improved their mental health.
We also asked if students have any comments on mental health and the law school.
Most of the comments painted a bleak picture:
- “From cold calling to the curve, every element is set out to make students feel worse about themselves and ‘less than’.”
- “The law school does not care about students’ mental health.”
- “The very structure of law school and the legal profession, as business-oriented, are inherently opposed to the mental wellbeing of the human beings whose minds serve as the ‘good’ or ‘product’ of the legal market. The Faculty providing mental health resources is like a person punching you in the face and then handing you a bandaid.”
- “By its very nature, law school is not good for anyone’s mental health.”
- “Law school is a lot of pressure, and it’s hard to individually recognize when we need help. Moreover, it’s hard to actually reach out and get help. I think the worsening mental health that occurs during recruit is a structural issue, which means a systemic approach rather than individual one.”
- “Garbage.”
Others pointed out ways the law school could improve its mental health support to students:
- “100% exams and papers cause a lot of stress. I really appreciate when teachers have assignments throughout the semester (especially those worth substantial marks) like midterms because it really helps decrease my anxiety at exam time (which is when it gets the worst).”
- “The faculty needs to do wayyyyy more than just sending emails. They do have resources that respond to anxiety/depression (counselling, etc.) and that is great. But, I think change needs to happen on a systemic level — change the system so as to prevent anxiety/depression/burnout from occurring, as opposed to responding to it after the fact.”
- “Admin needs to do more. Students also need to do more preventive mental health activities.”
- “The On-Location Student Mental Health Counsellor is fantastic. But there’s only one dedicated person for the entire law school. And you only get six sessions with her. They really helped me but they’re not a long-term solution.”
Some students took a different, more optimistic perspective:
- “Law school positively impacted my mental health.”
- “I still believe it’s possible to be a happy law student despite the course load, the extracurriculars, and the pressure to get a job — but that requires a strong heart and good stress management abilities. I think it’s important to remember I’m a person with interests, dreams, and identities outside of law school and not let the law student part of my life define myself.”
Political Beliefs, Alcohol, and Marijuana Use
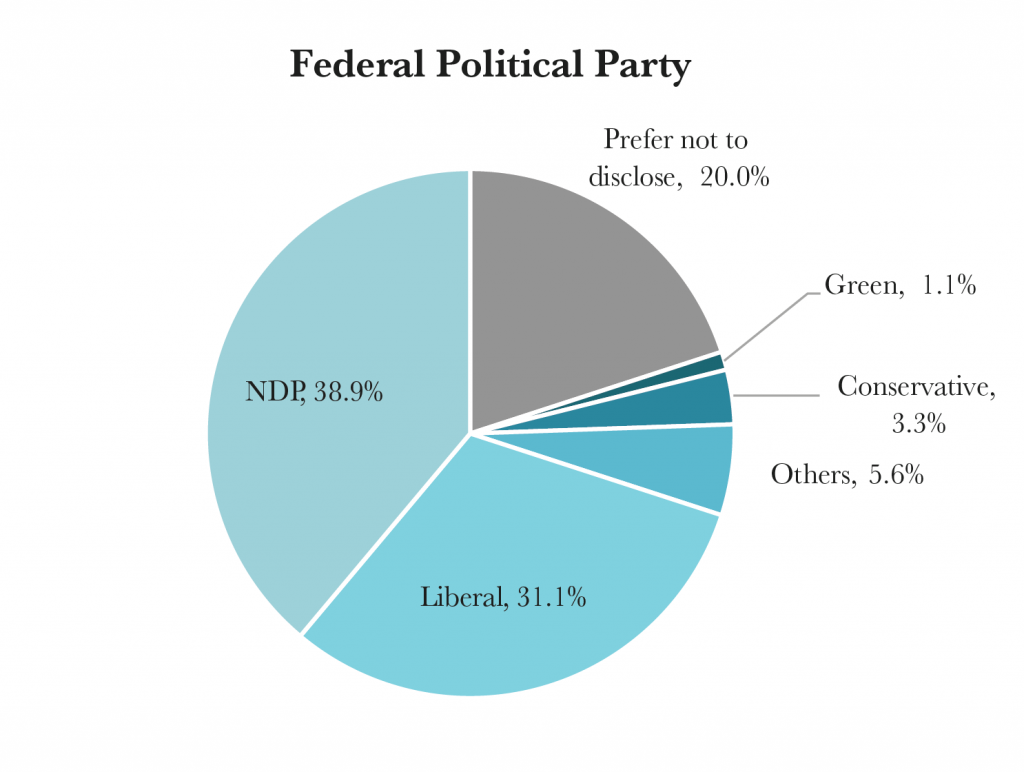
In the concluding questions of our survey, we asked students to identify the federal parties they currently support. The most supported party was NDP (39 percent), followed by Liberal (31 percent). However, 20 percent of survey respondents preferred not to disclose their party affiliation.
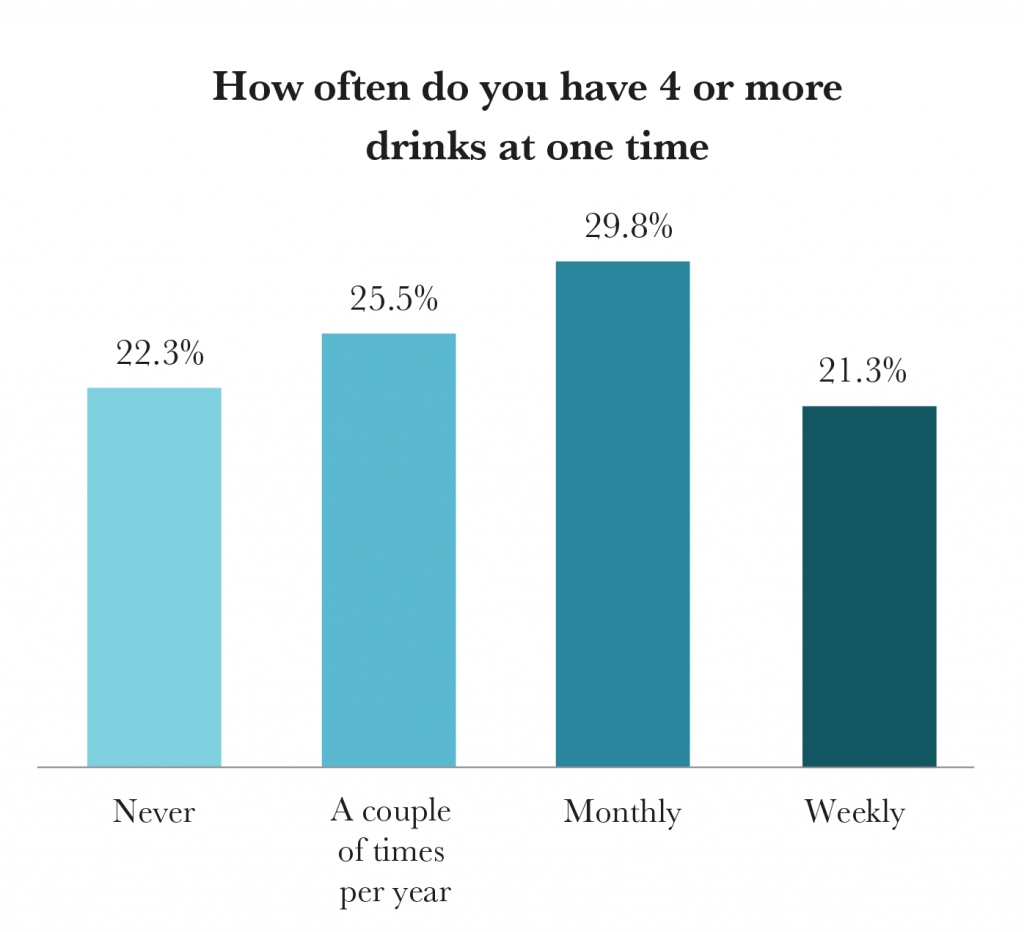
We asked how often students have four or more drinks at one time, and the responses were more evenly distributed. The most reported category was “monthly” (30 percent), followed by “a couple of times per year” (25 percent). However, there were similar shares of students who answered “never” (22 percent) or “weekly” (21 percent).
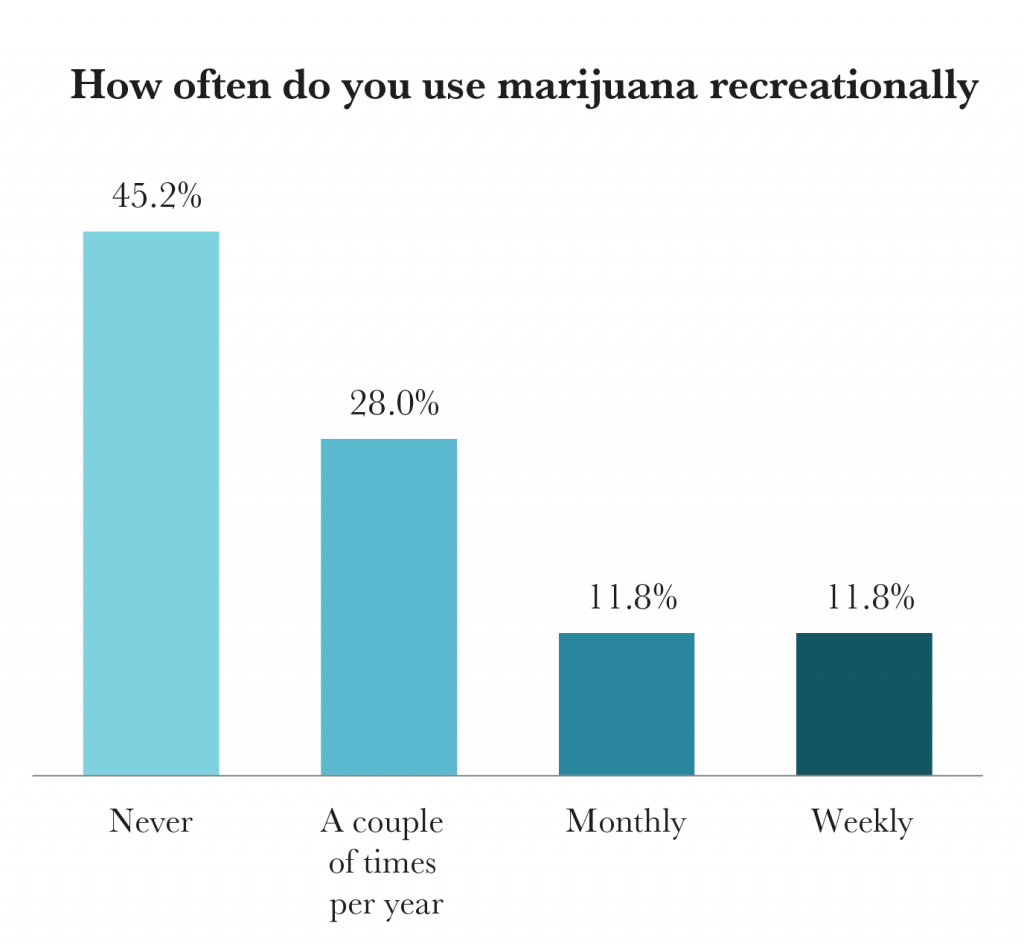
Finally, for the question about the frequency of recreational marijuana use, 45 percent of students responded “never.” 28 percent of students answered “a couple of times per year”. The share of students who answered “monthly” or “weekly” was 11 percent, respectively.
