Editor’s Note: The information below is meant to express correlations between certain factors and job offers in the formal recruit. The data does not suggest that these factors caused these outcomes nor that a student must have certain qualities (like a specific GPA) in order to be successful. Important factors like personality and interviewing ability are overlooked.
The 2023 2L Toronto Summer Recruit finally concluded on Wednesday, November 9, 2022, after many long weeks of preparation following the application deadline at the end of July. Every year, Ultra Vires sends an annual survey to U of T Law students on the recruit. The purpose of the survey is to better inform future applicants, raise awareness on matters of student concern, and to provide a historical record of year-to-year changes associated with the recruit.
This year’s survey saw a decrease in student responses, with only 52 responses representing approximately 24 percent of the 2L class size. Of the 52, four students (seven percent) were in combined-degree programs. Thirty-nine survey participants identified as female, 12 as male, and two as non-binary. Nineteen identified as racialized and 32 as non-racialized.
Of the respondents, 44 participated in the recruit. Of those, 36 received and accepted an offer through the recruit (82 percent placement rate), while seven did not.
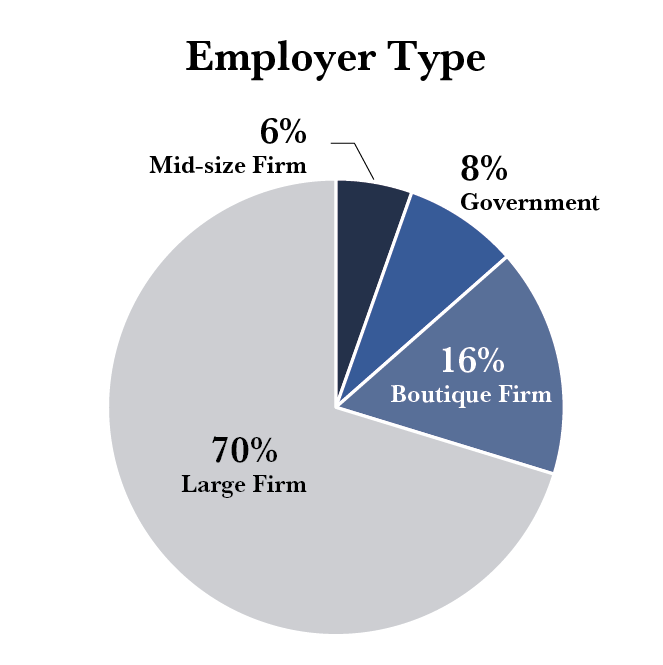
Of the students who accepted an offer, 70 percent went to large firms, 16 percent to boutique firms, 8 percent to government positions, and 5 percent to mid-size firms.
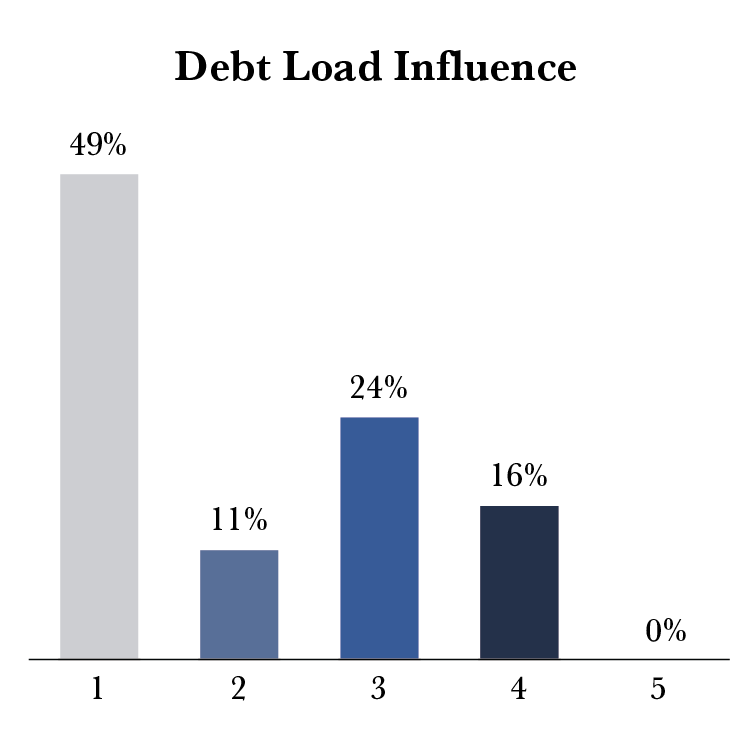
About half of all students that participated in the recruit (48.9 percent) expressed that their expected debt level had no influence on their recruitment decisions, while only 15.6 percent said that it had some influence, but no students expressed that their debt load was the primary influence in their employment decisions.
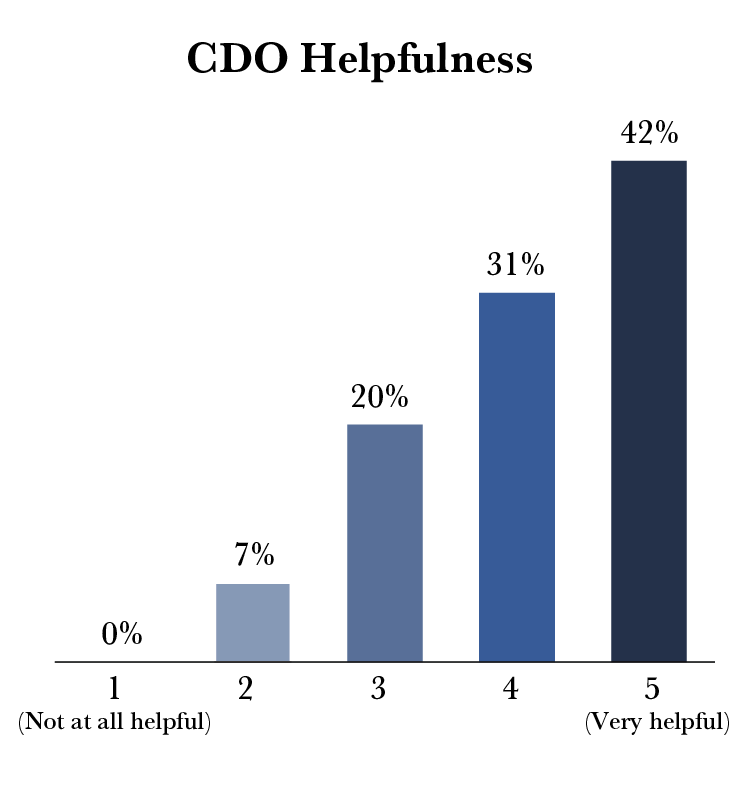
A significant portion of students found the Career Development Office (CDO) very helpful (42 percent) or helpful (31 percent)
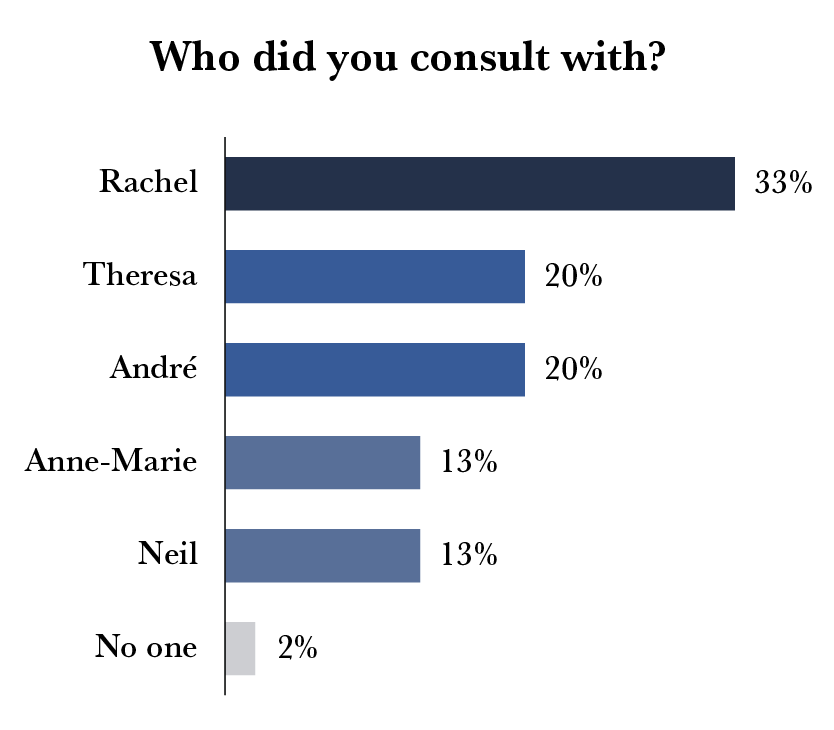
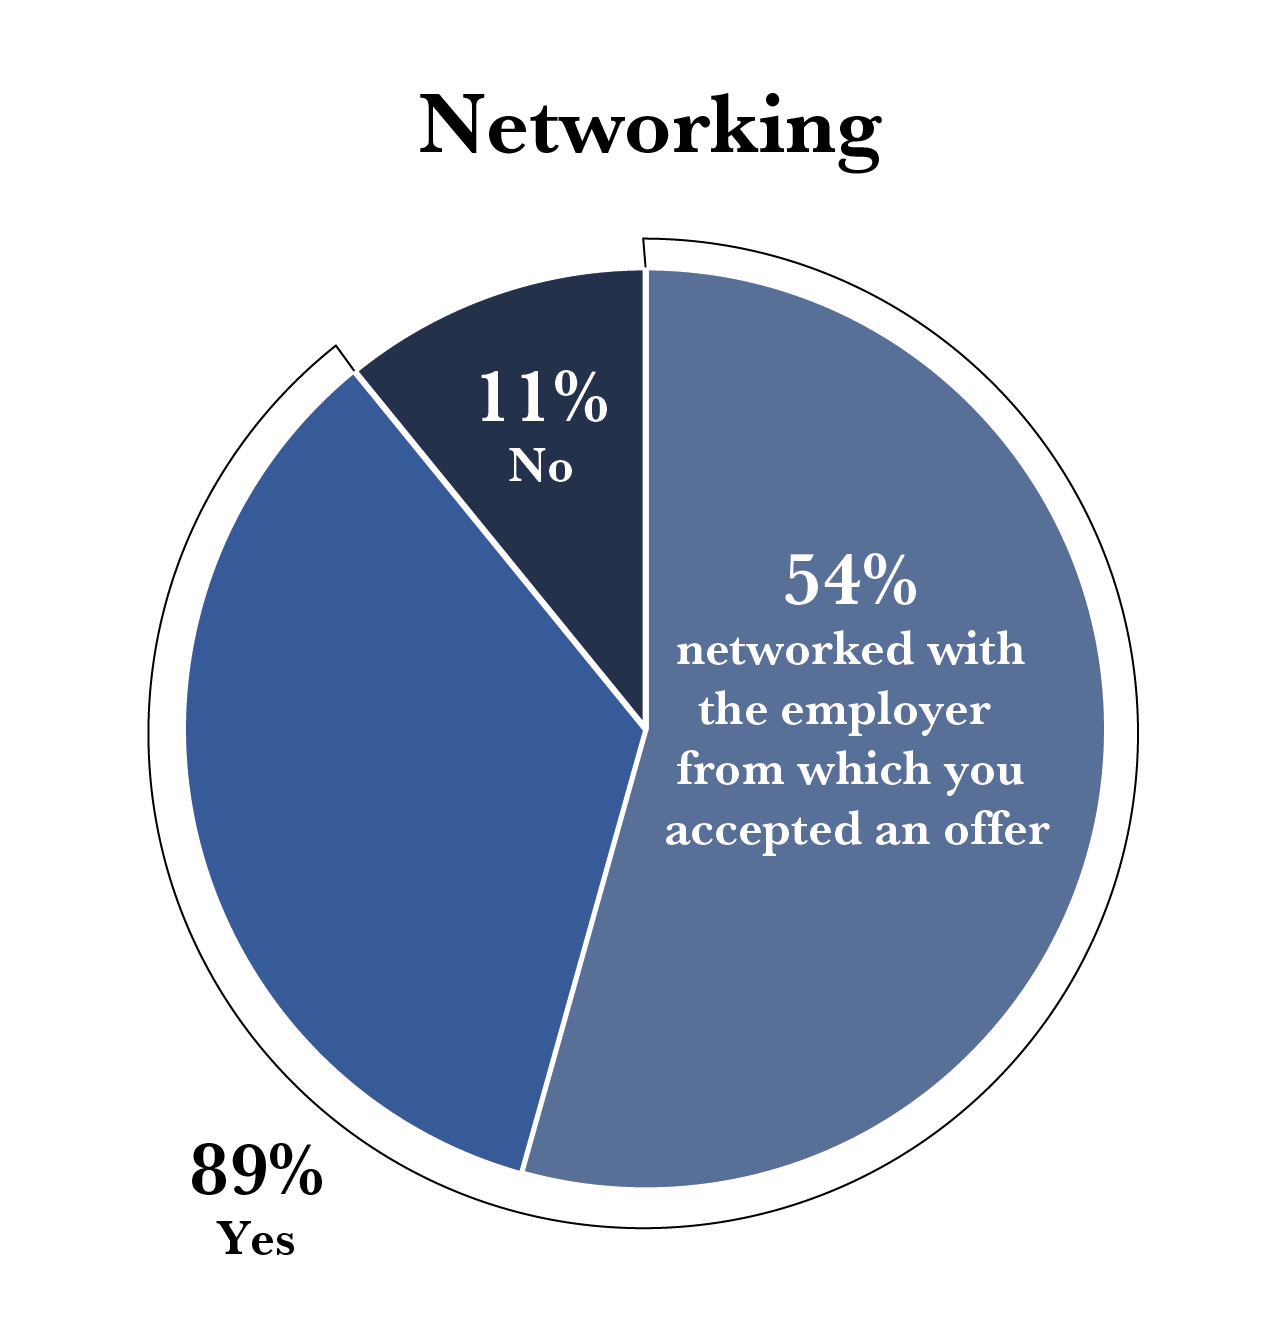
A majority of students (89 percent) participated in some sort of networking during the recruitment process.
One student’s responses were eliminated because they did not report complete 1L grades. In total, 43 students’ responses proceeded to the subsequent analysis. We expect that students who performed better academically or were satisfied with the outcome of the recruit may be more likely to participate in the survey. As a result of this self-selection bias, students with HHs and Hs are likely to be overrepresented at the expense of those reporting Ps. The expected grade percentage is based on the Faculty’s grade distribution guidelines to instructors.
| Grade | Expected | Reported | Representation |
|---|---|---|---|
| HH | 15% | (46) 15.14% | 0.14% overrepresentation |
| H | 30% | (128) 33.43% | 3.43% overrepresentation |
| P | 55% | (127) 51.49% | -3.51% underrepresentation |
| LP | 0% | (0) 0% | N/A |
| F | 0% | (0) 0% | n/a |
Furthermore, compared to the U of T Law Class of 2024 profile statistics, there was an overrepresentation of females who completed the survey (75 percent vs 59 percent). Additionally, there was an overrepresentation of non-racialized students who completed the survey (62 percent vs 49 percent).
Correlations Between Grades, On-Campus Interviews (OCIs), In-Firm Interviews, and Offers Received
Similar to previous years, we assigned a numerical GPA to each letter grade (i.e., HH = 5, H = 4, P = 3, LP = 1) and treated courses as equivalent in weight under the assumption that employers do not take into account each course’s weight.
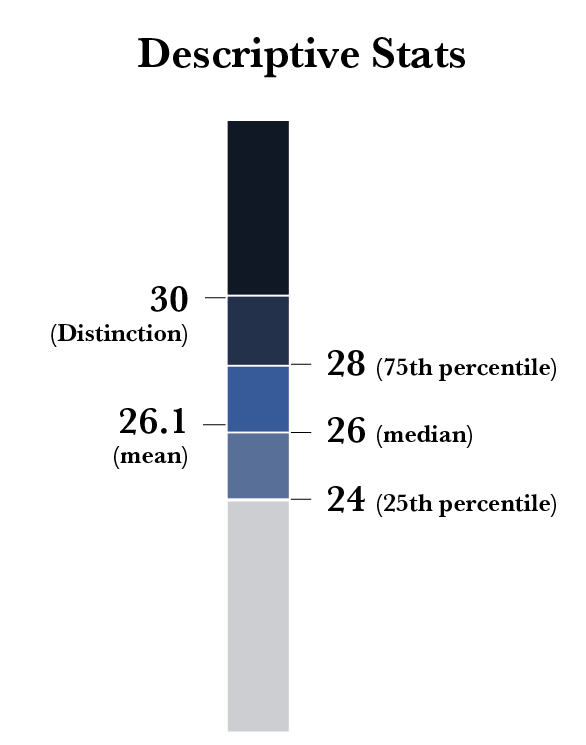
From our sample, the median applicant in the 2023 Toronto Recruit had a GPA of 26; this is equivalent to 5 Hs and 2 Ps or 1 HH, 3 Hs, and 3 Ps, etc. The 25th percentile GPA was 24, the 75th percentile was 28, and distinction standing (the 90th percentile) was 30.
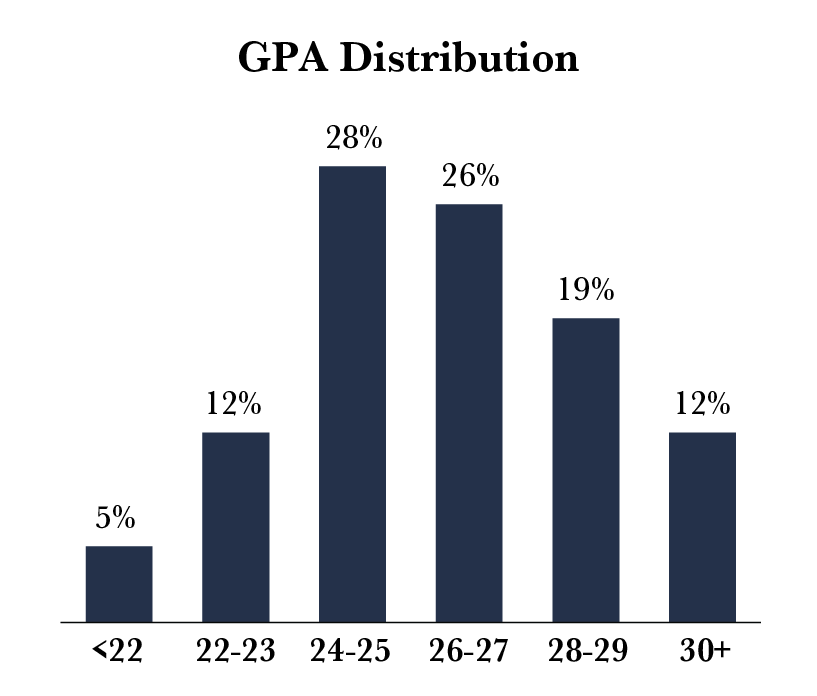
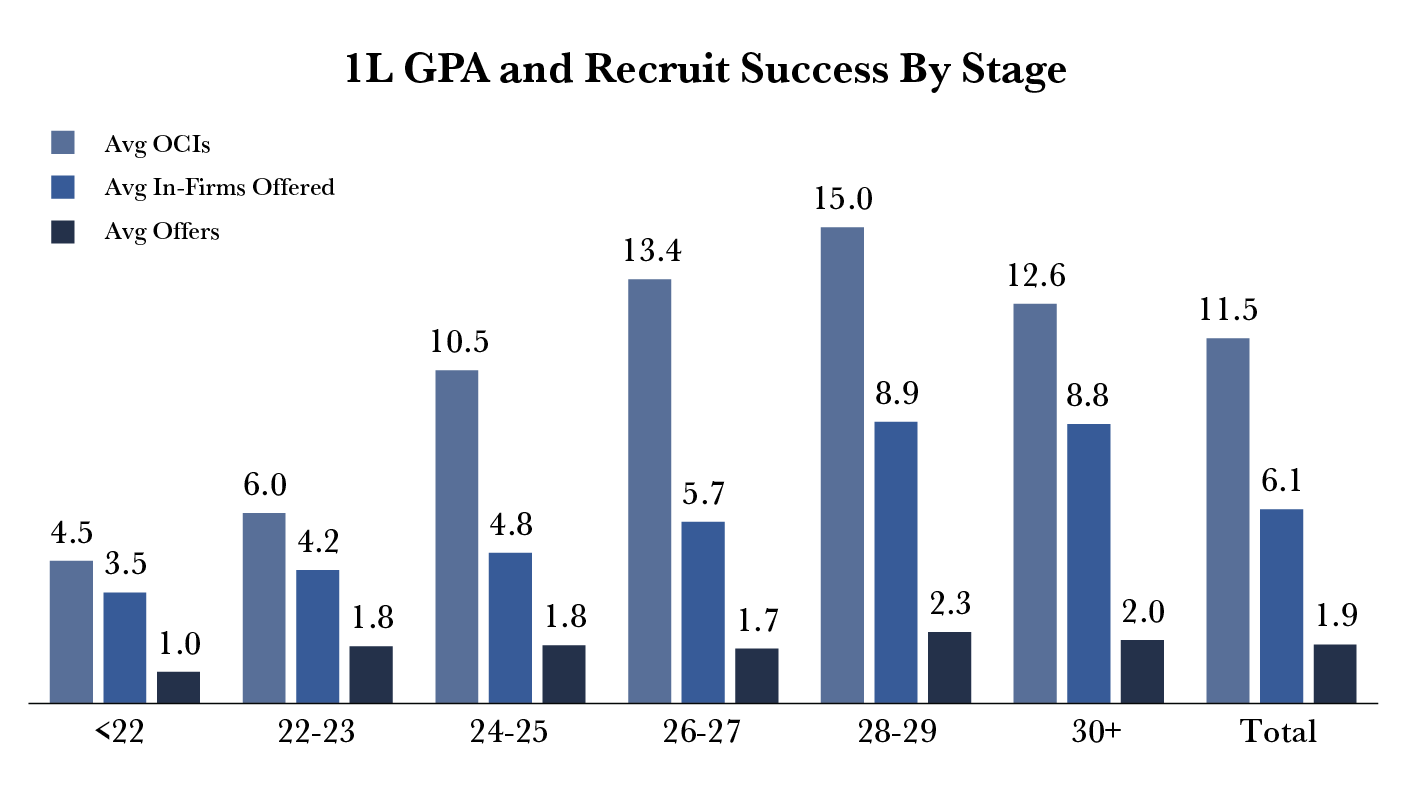
There was a strong upward trend in the average number of OCIs received, the number of in-firm interviews received, and the number of offers received as GPA increased until the 28–29 GPA range, after which the trend appears to decline for those in the GPA range above 30.
Using the Spearman rank correlation test, the relationship between GPA and number of OCIs was statistically significant with a moderate correlation.
| In-Firm Interview Invitations Received | Total Number of Students | Number of Students Who Secured Employment | Employment (%) | 2022 Employment (%) | 2021 Employment (%) |
|---|---|---|---|---|---|
| 1 | 2 | 1 | 50% | 50% | 38% |
| 2 | 4 | 1 | 25% | 50% | 45% |
| 3 | 7 | 7 | 100% | 79% | 69% |
| 4 | 7 | 5 | 71% | 75% | 88% |
| 5 | 2 | 2 | 100% | 82% | 90% |
| 6 | 3 | 3 | 100% | 100% | 100% |
| 7 | 6 | 6 | 100% | 100% | 100% |
| 8 | 1 | 1 | 100% | 100% | 100% |
| 9 | 2 | 2 | 100% | 100% | 100% |
| 10+ | 7 | 7 | 100% | 100% | 100% |
| In-Firm Interviews Attended | Total Number of Students | Number of Students Who Secured Employment | Employment (%) | 2022 Employment (%) | 2021 Employment (%) |
|---|---|---|---|---|---|
| 1 | 2 | 1 | 50% | 50% | 40% |
| 2 | 4 | 1 | 25% | 60% | 55% |
| 3 | 8 | 8 | 100% | 80% | 67% |
| 4 | 11 | 9 | 82% | 90% | 93% |
| 5 | 9 | 9 | 100% | 95% | 95% |
| 6 | 4 | 4 | 100% | 100% | 100% |
| 7 | 2 | 2 | 100% | 100% | 100% |
| 8+ | 1 | 1 | 100% | 100% | N/A |
Similar to last year, these results suggest that students with higher GPAs tend to secure more OCIs and in-firm interviews, but GPA alone had a weak correlation when it comes to ultimately securing an offer.
Effect of Gender and Race
Gender
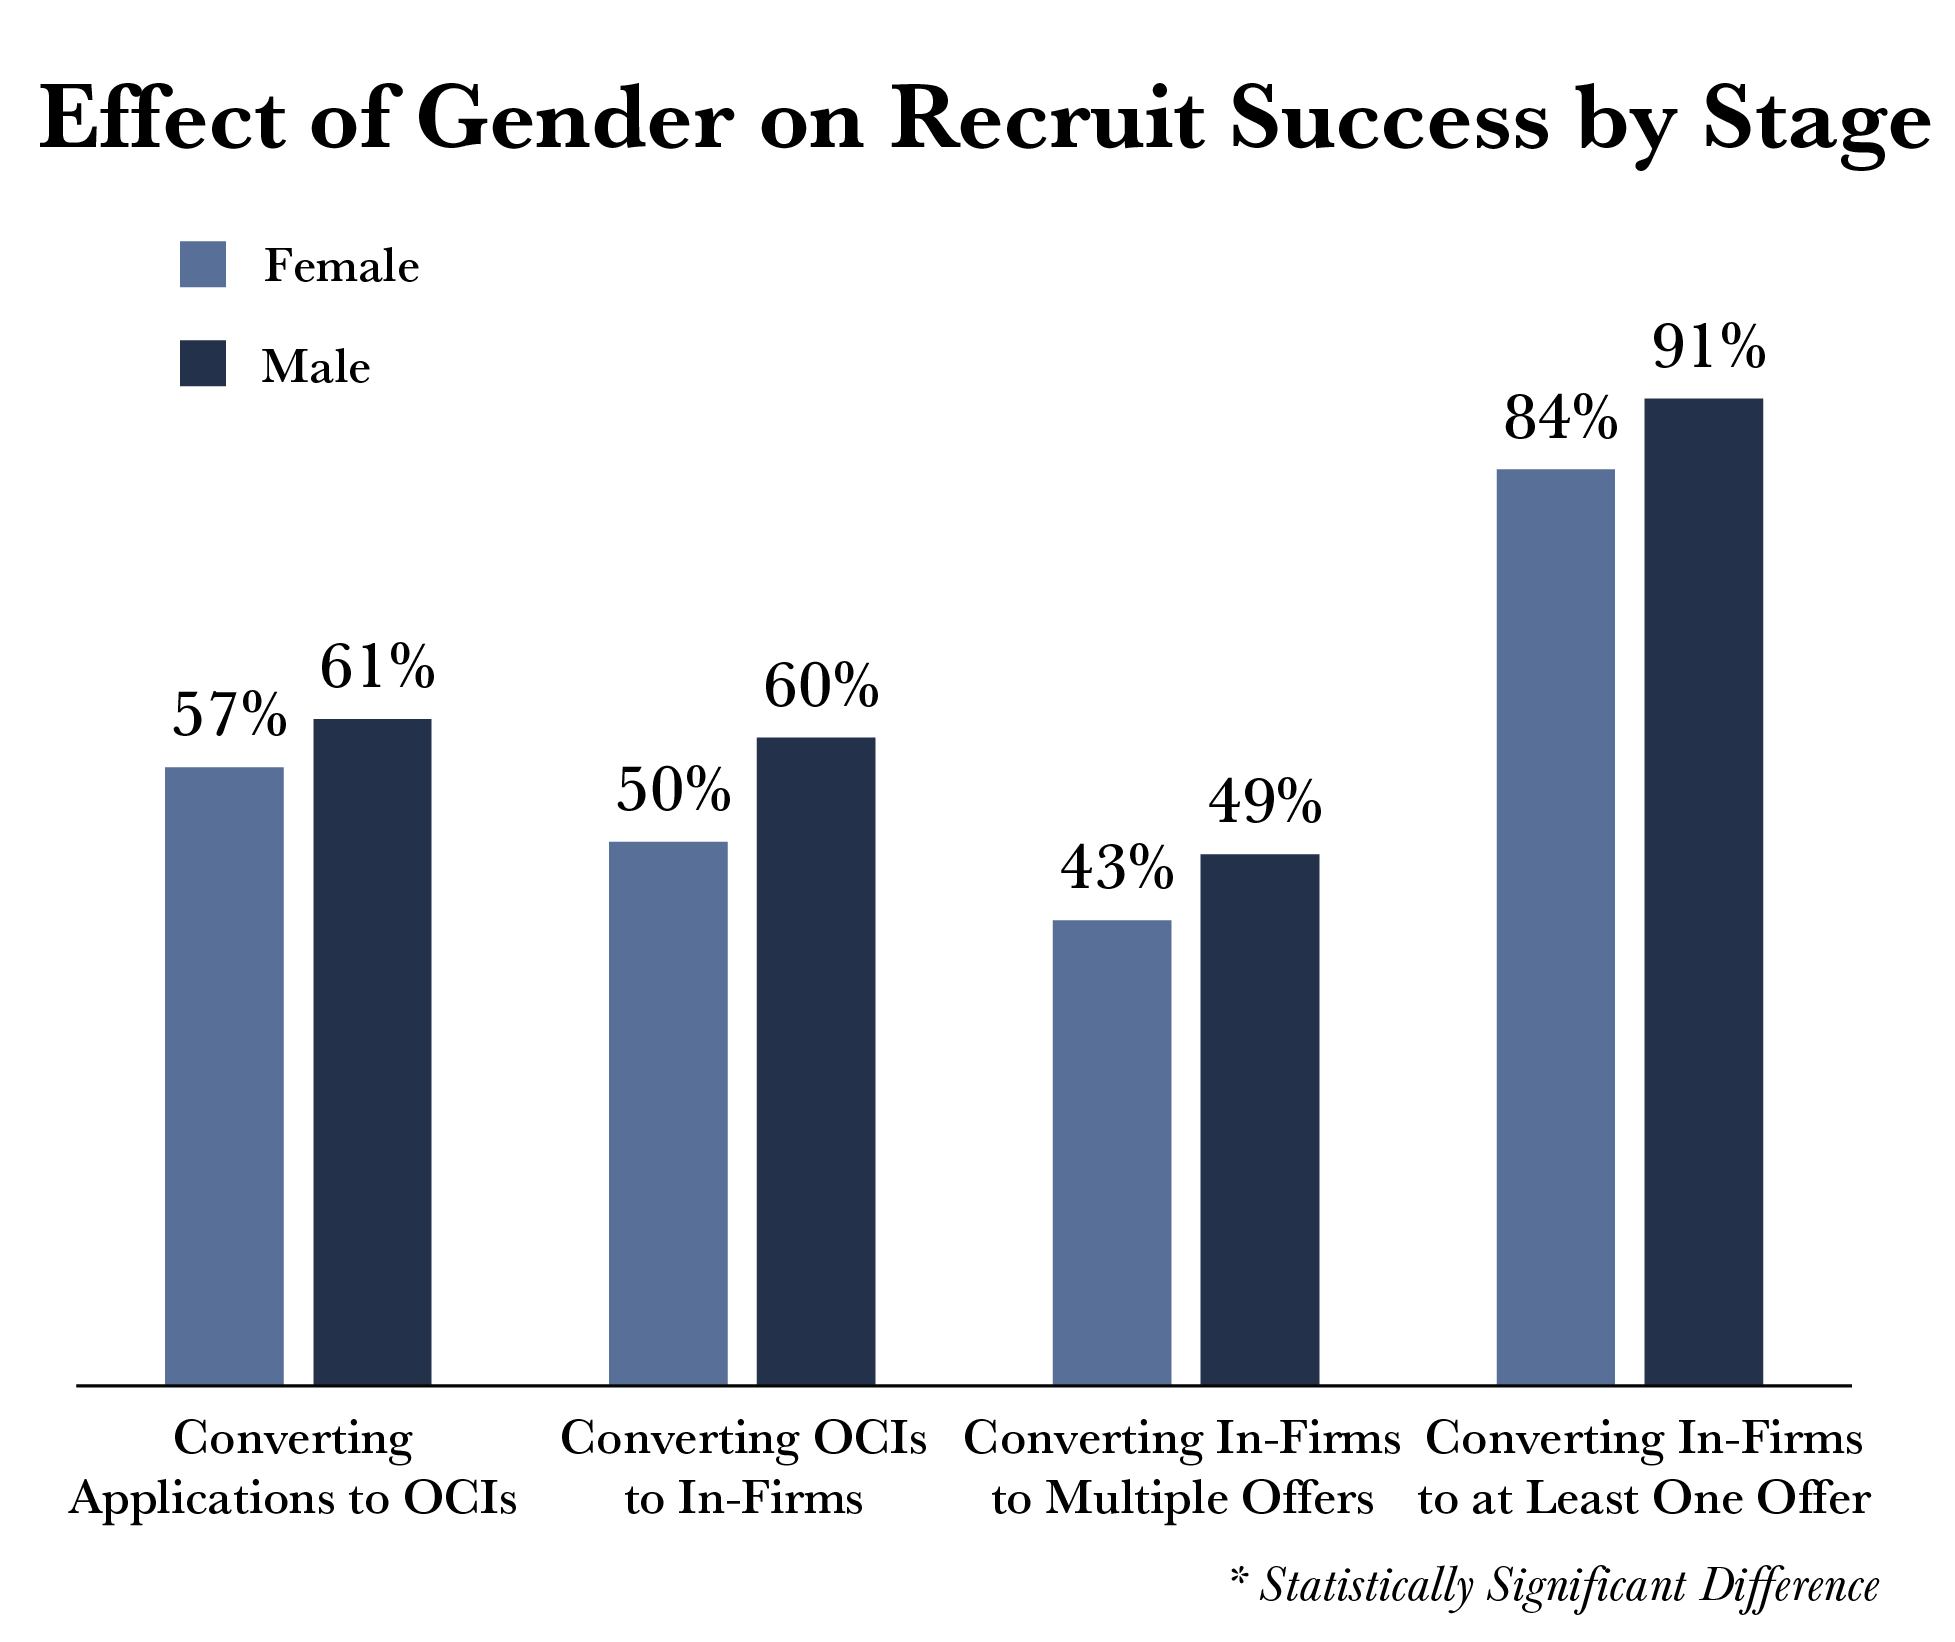
With regard to gender, males showed more success than females at every stage of the recruit. The data set this year did not demonstrate any statistical significance using the Mann-Whitney U test (likely due to a smaller data set). Based on the responses, applications from males were more likely to convert to OCI interviews (61 percent vs 57 percent).
Race
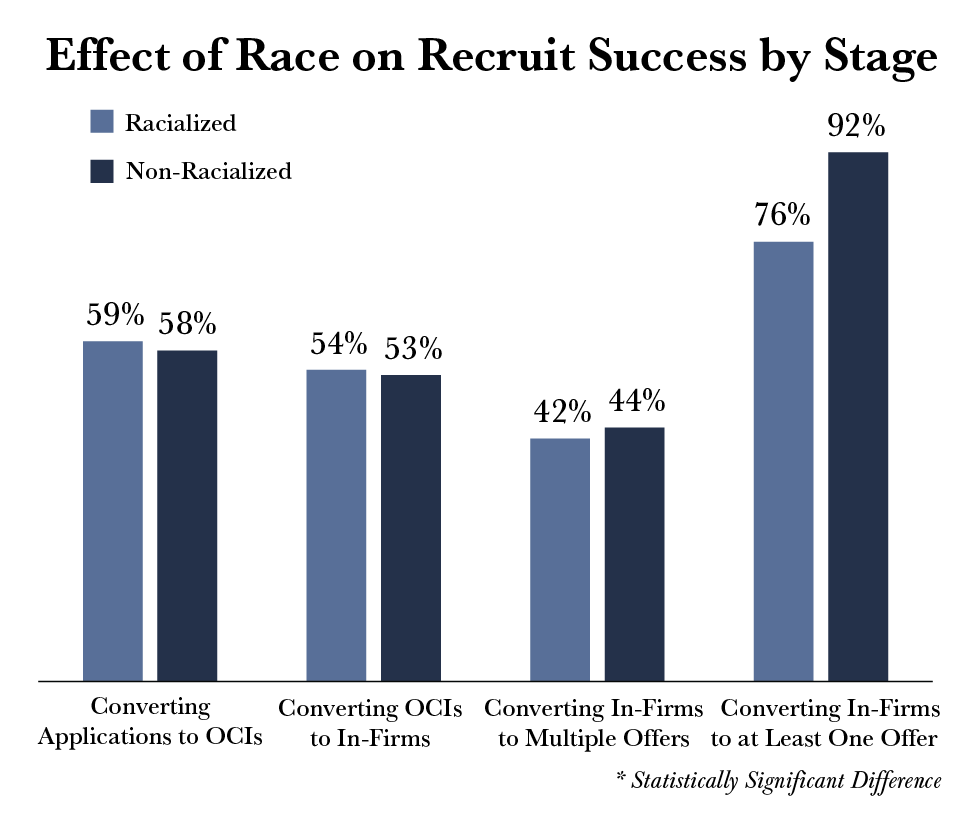
This year’s sample showed interesting results with respect to the effect of race on recruit success. Once again, none of the following associations tested statistically significant. Compared to applications of non-racialized students, applications of racialized students were slightly more likely to convert to OCIs (59 percent vs 58 percent).
Race and Gender Combined
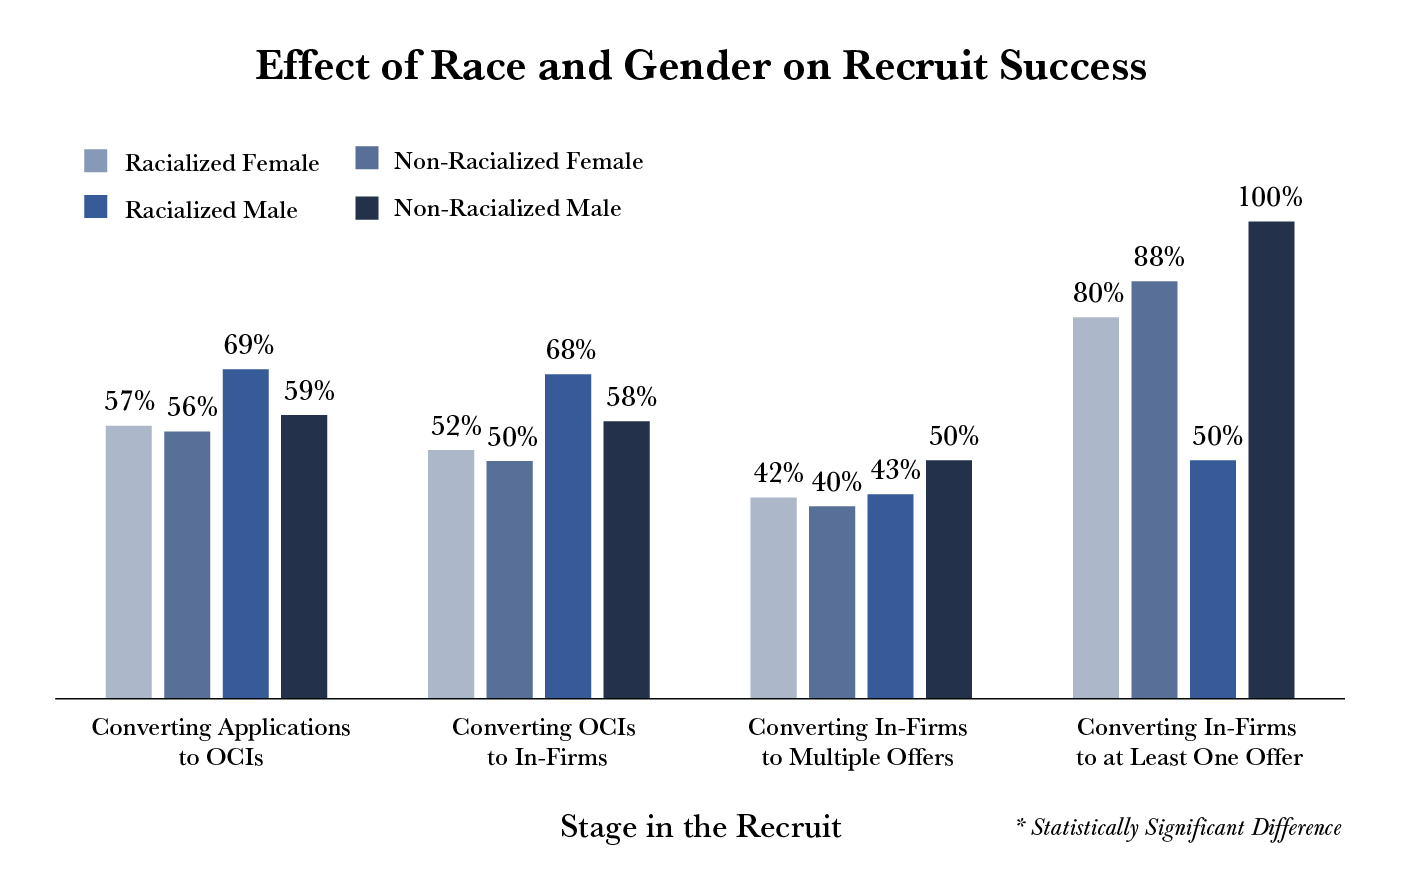
Finally, when looking at both race and gender combined, the data again does not demonstrate any statistical significance. Nonetheless, based on our data, racialized males achieved the highest rates of conversion at the OCI and in-firm interview stages, while non-racialized males followed. However, at the offer stage, success is flipped with non-racialized males achieving the highest rates of conversion, with racialized males following.
Editor’s Note: Analysis was limited to male and female genders due to the limited non-binary responses