Recruit success is associated with grades, number of interview invitations received and attended, race, and gender
After 11 weeks of intense research, applications, networking, and interviewing, the Toronto 2022 Summer Recruitment concluded with Offer Day on November 3, 2021. Every year, Ultra Vires sends an annual survey to U of T Law students to glean insights into this complicated and emotional process. The objectives are three-fold: (i) to better inform future generations of applicants; (ii) to raise awareness on matters of student concern so action can be taken; and (iii) to provide a historical record of year-to-year changes associated with the Toronto recruit.
The Survey
This year’s survey saw an increase in response rate: 130 students, representing 61 percent of the 2L cohort.
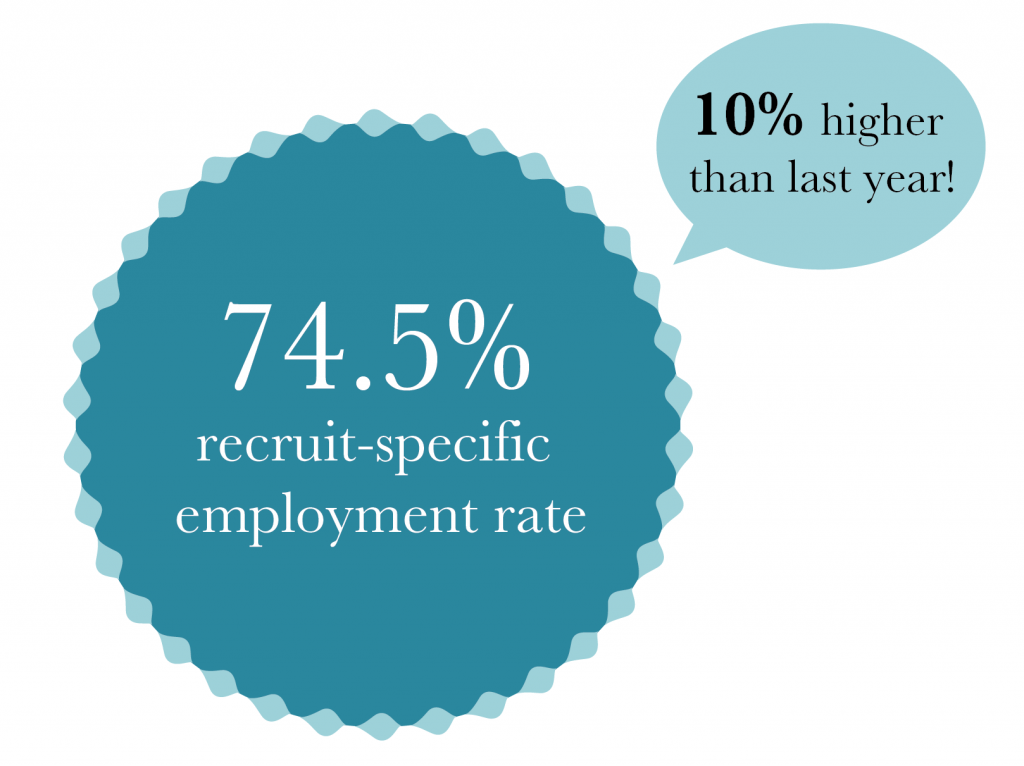
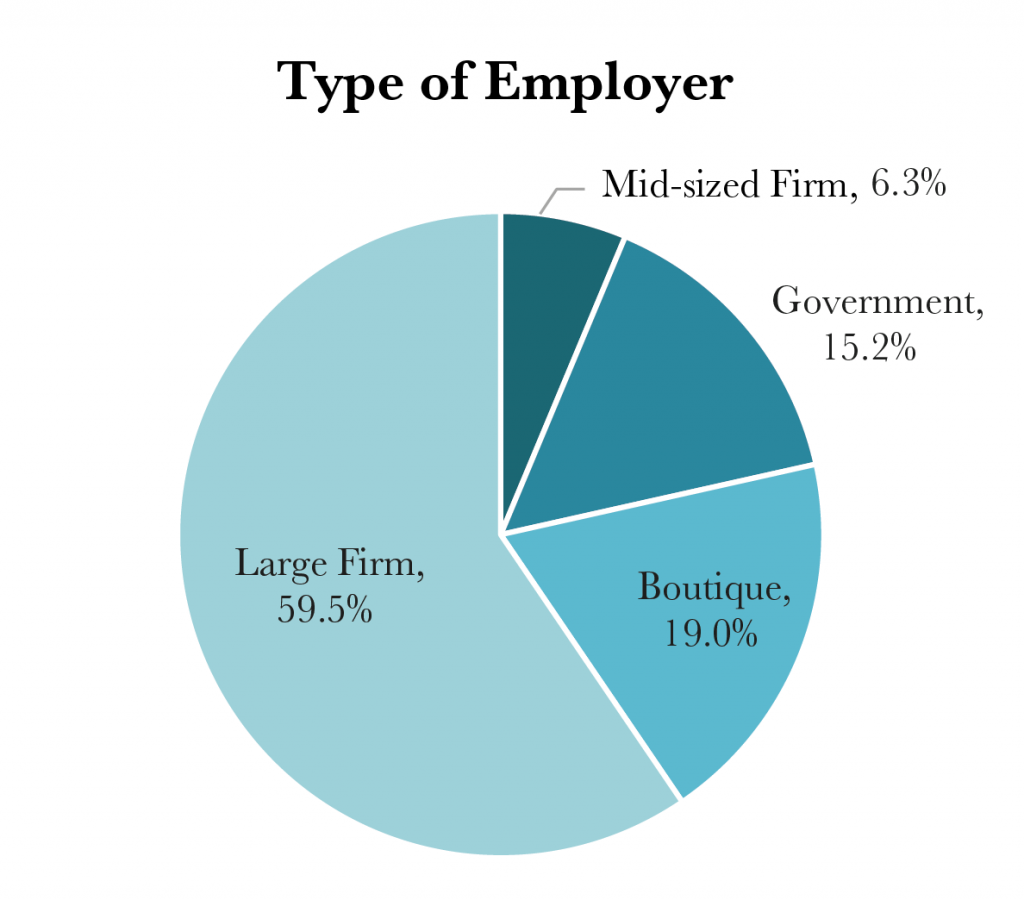
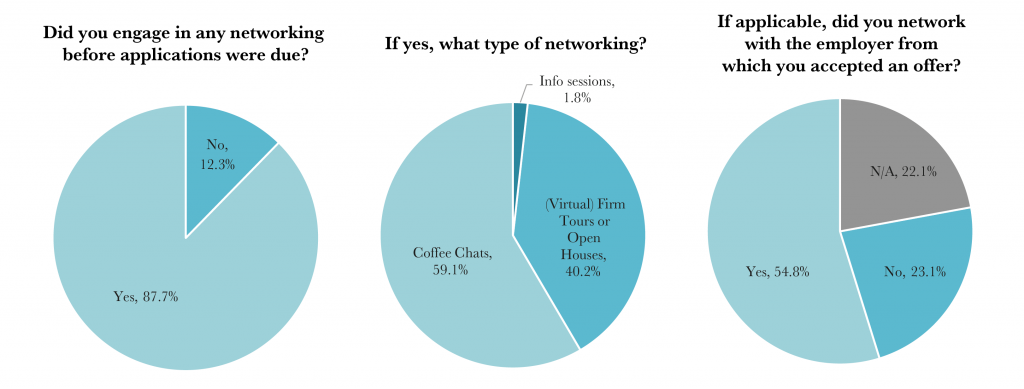
106 students participated in the recruit. Of those, 79 students received and accepted an offer through the recruit (74.5 percent recruit-specific employment rate) while 27 did not (25.5 percent). This employment rate is markedly higher than the previous year’s 65.9 percent. Of the 79 students that obtained recruit-specific employment, 59.5 percent went to large firms, 19 percent to boutique firms, 15.2 percent to government positions, and 6.3 percent to mid-sized firms. About half of all students that participated in the recruit (47.5 percent) expressed that their expected debt level had no influence on their recruitment decisions, while only 8.9 percent said that it was the primary influence. In addition, the majority of students found the CDO very helpful (33.3 percent) or helpful (39.0 percent) in the process.
| Did your expected debt load influence your final decision? | |
| Level of Influence | Percent |
| 5 (Primary influence) | 8.9% |
| 4 | 14.9% |
| 3 | 16.8% |
| 2 | 11.9% |
| 1 (No influence) | 47.5% |
A Note About the Numbers
Nine students’ results were eliminated because they did not report any 1L grades. In addition, four dual-degree students provided only three 1L grades (probably due to the mandatory CR/NCR policy implemented in Winter 2020). For these four students, the average of the three available grades was taken and inputted for the missing four 1L grades (“GPA Scaling”) to allow them to proceed further in the analysis. Finally, one student had a missing grade in one 1L course and GPA Scaling was done to fill in the missing grade. In total, 97 students proceeded to the subsequent analysis.
Before proceeding, it is important to acknowledge the effect of self-selection bias. Students may be more likely to participate in the survey and share their results if they performed better academically or were more satisfied with the outcome of the recruit. The below table shows distribution of 1L grades, where H’s and HH’s are overrepresented at the expense of P’s.
| Grade | Expected (%) | Actual (%) | Representation |
| HH | 100 (15%) | 113 (17.1%) | 14% overrepresentation |
| H | 200 (30%) | 268 (40.5%) | 35% overrepresentation |
| P | 366 (55%) | 277 (41.8%) | 24% underrepresentation |
| LP | 0% | 4 (0.6%) | N/A |
| F | 0% | 0 (0.0%) | N/A |
Correlations Between Grades and OCIs, In-Firm Interviews, and Offers Received
Similar to previous years, we assigned a numerical GPA to each letter grade (i.e., HH = 5, H = 4, P = 3, LP = 1) and treated courses as equivalent in weight under the assumption that employers do not take into account each course’s weight.
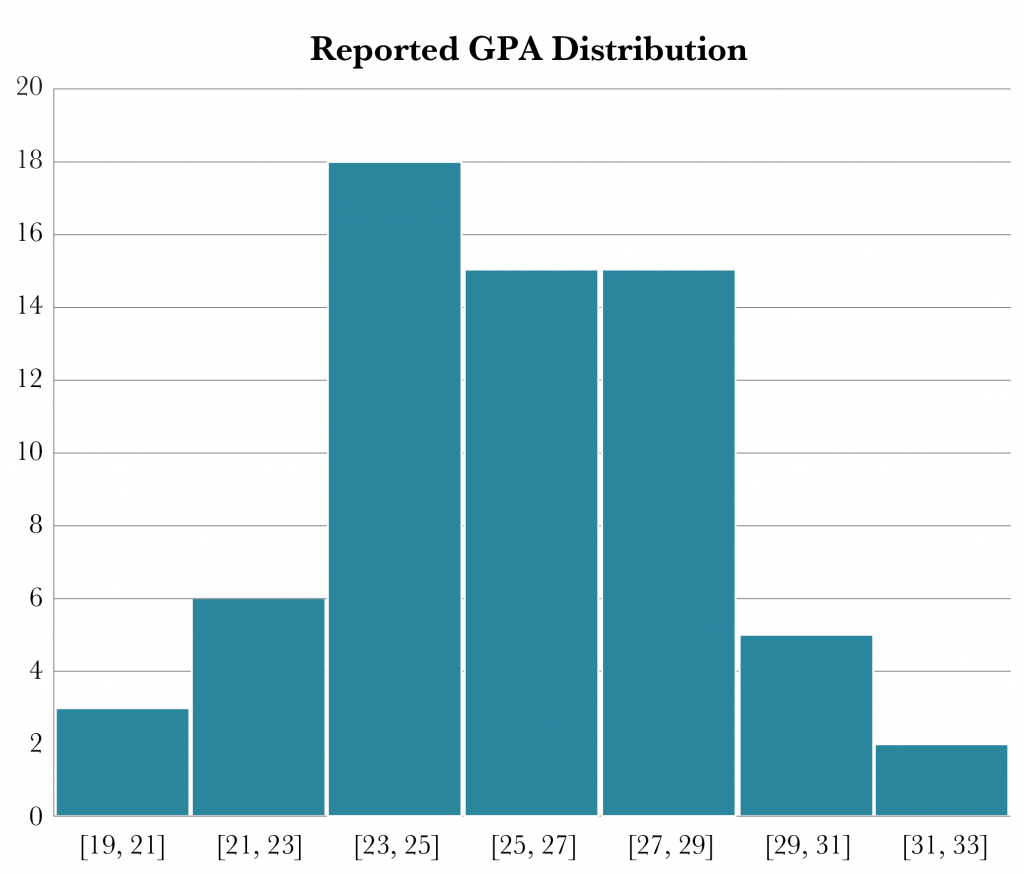
From our sample, the median applicant in the 2022 Toronto Recruit had a GPA of 26. This is equivalent to 5 H’s and 2 P’s or 1 HH, 3 H’s, and 3 P’s, etc. The 25th percentile GPA was 24, the 75th percentile was 28, and distinction standing (i.e., the 90th percentile) was 30.

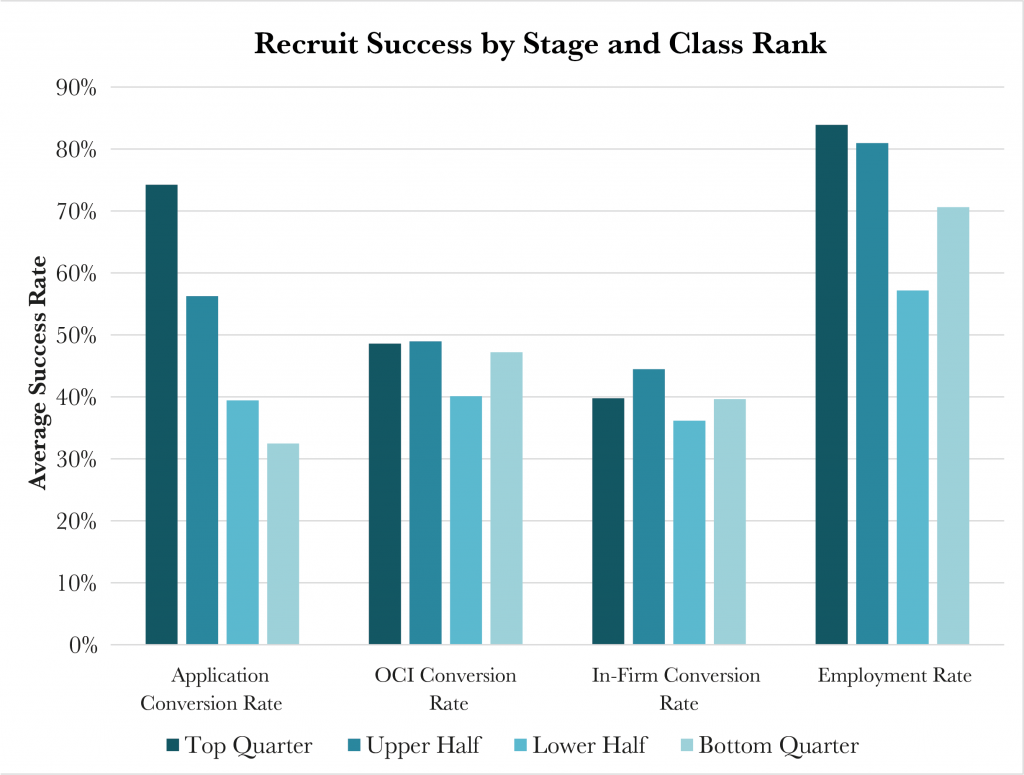
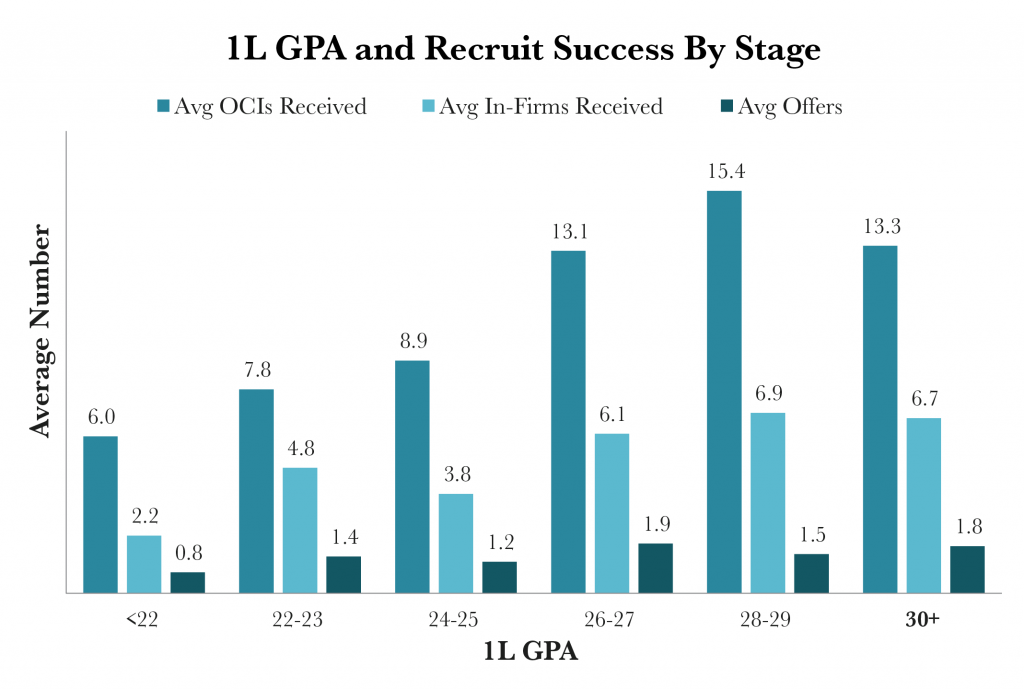
There is a strong upward trend in the average number of OCIs received, number of in-firm interviews received, and number of offers received as GPA increases. The trend is still evident when grades are divided into more granular units. Some of these relationships tested statistically significant. Using the Spearman rank correlation test,
In terms of obtaining employment through the recruit (i.e., receiving at least one offer), logistic regression revealed statistically significant associations between the number of OCIs received and employment,
All these results suggest that students with higher GPAs tend to secure more OCIs and in-firm interviews, but GPA alone does not have a significant correlation when it comes to ultimately securing an offer. Across all the variables examined, the best predictor of securing employment through the recruit was the number of in-firm interviews attended, where odds are tripled with each additional interview attended.
Effect of Gender and Race
Gender
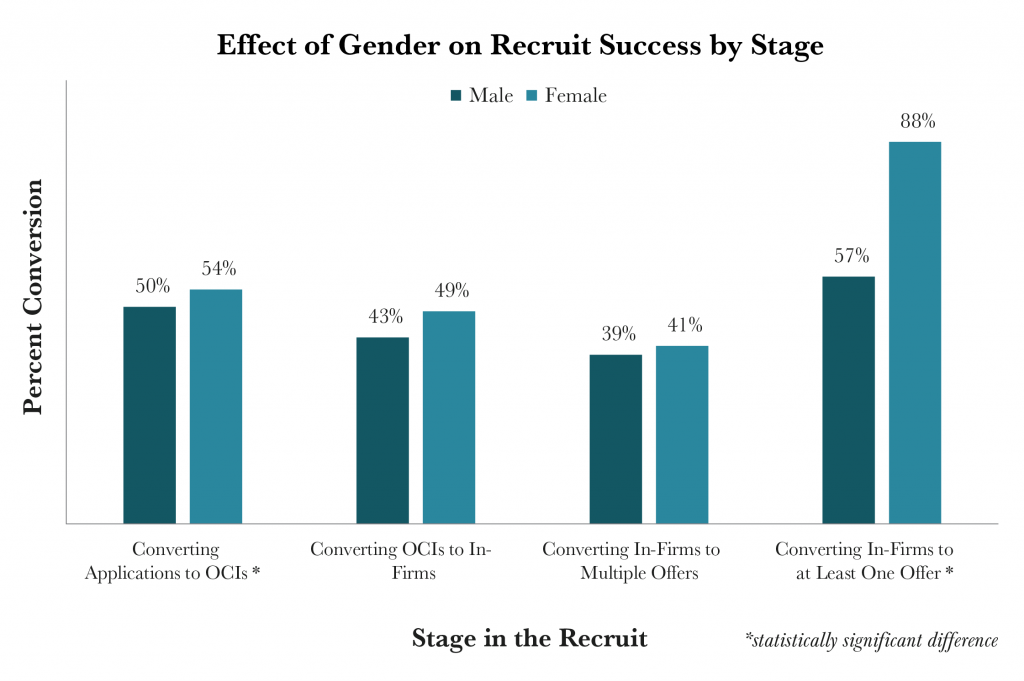
This year’s sample showed interesting results with respect to the effect of gender and race on recruit success. With regards to gender, females showed more success than males at every stage of the recruit. The following relationships tested statistically significant: (1) applications by females were more likely to convert to OCIs than males (54 percent vs. 50 percent);
This trend is a positive sign, suggesting a focus by employers to hire more members of a historically underrepresented class in the legal profession.
Race
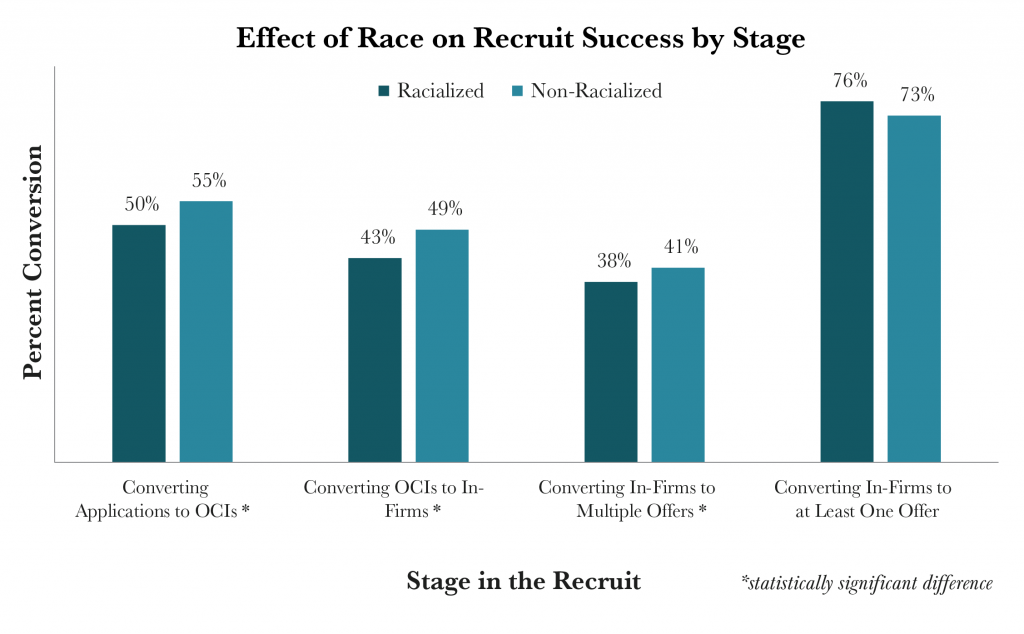
With respect to race, the results paint a different picture. The following associations all tested statistically significant. Compared to applications coming from students who identified as racialized, applications coming from students who identified as non-racialized were more likely to convert into OCIs (55 percent vs. 50 percent),
The picture with regards to race is mixed, where the data suggests that non-racialized students had a higher chance of success in all stages of the recruit, except when it came to securing at least one offer.
Race and Gender Combined
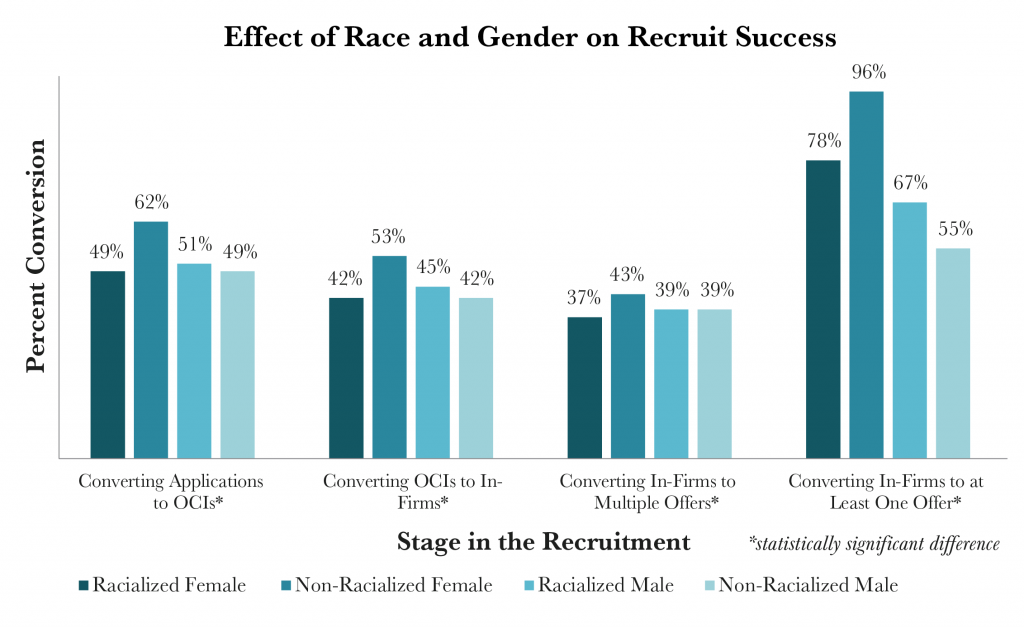
When looking at both race and gender combined, we see that they play a statistically significant role in every stage of recruit success.
These results suggest that there is a strong push towards hiring students from more diverse demographics at all stages of the recruit. Across race and gender, students identifying as female demonstrated the highest level of success across all stages of the recruit, while racialized students demonstrated mixed outcomes at different stages of the recruit.
Editor’s Note: Hussein E. E. Fawzy participated in the 2022 Toronto Summer Recruit.


